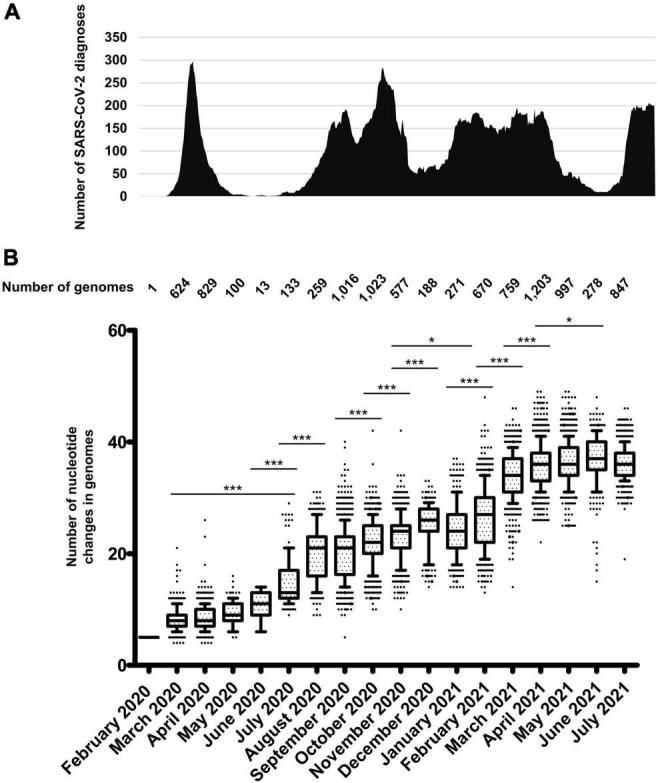
FIGURE 2.

Chronological distribution of SARS-CoV-2 diagnoses by qPCR at IHU Méditerranée Infection institute (A), and of mean (± standard deviation) numbers of mutations in SARS-CoV-2 genomes obtained from patients sampled per month (B). (A) Chronological distribution of SARS-CoV-2 diagnoses is the mean number of diagnoses by qPCR per sliding windows of 7 days and steps of 1 day. (B) Numbers of mutations in SARS-CoV-2 genomes were calculated in reference to the genome of the Wuhan-Hu-1 isolate (GenBank Accession no. NC_045512.2). Whiskers indicate 10–90 percentiles. *p < 10–1; ***p < 10–3.
