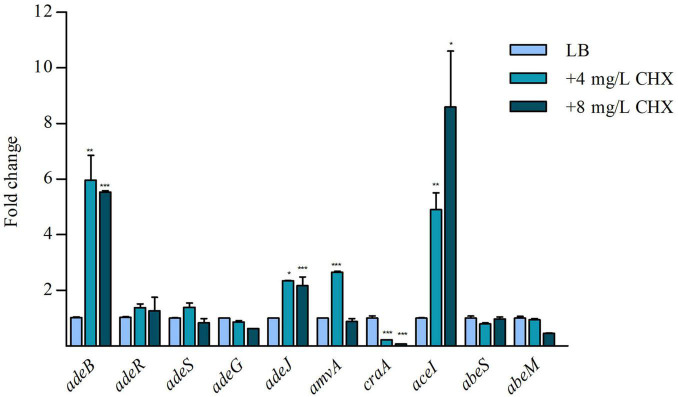
FIGURE 2.
RT-qPCR assay of adeB, adeR, adeS, adeG, adeJ, amvA, craA, aceI, abeS, and abeM expression in the presence of LB and 4 mg/L and 8 mg/L CHX. Relative number of transcripts of each gene was normalized in each condition and calculated using the 2–ΔΔct method compared to the expression level in LB control. The mean + standard deviation of relative number of transcripts is shown for each gene. All experiments were performed in triplicate. p-values were calculated using ANOVA (*p < 0.05; **p < 0.01; ***p < 0.001).

