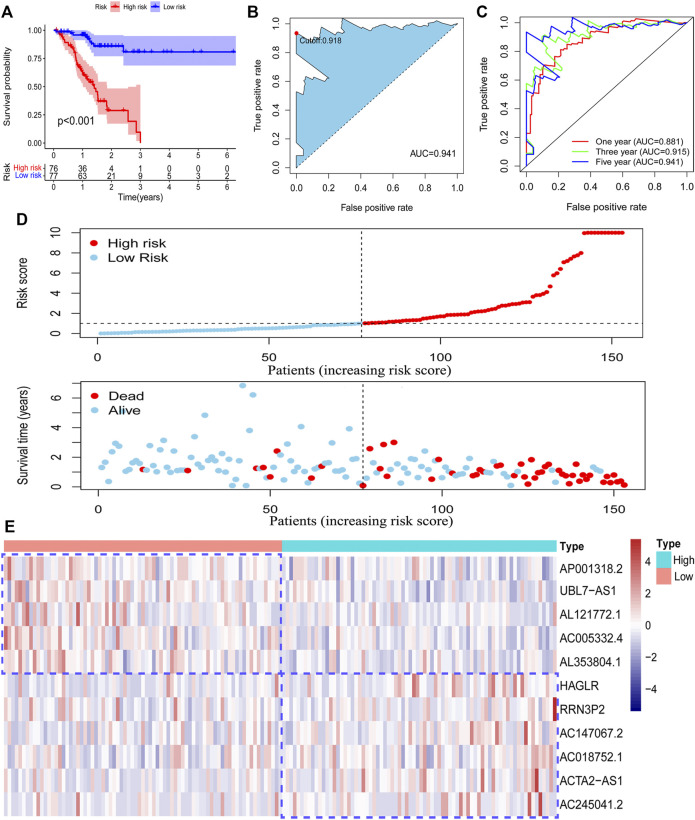
FIGURE 3.
Survival analysis of the risk model. The survival difference between the low-risk patients and high-risk patients in the training set (A). A time-dependent ROC curve was plotted to test the accuracy of the risk model (B, C). Patients in the training set were ranked according to the risk score. Then, the survival status difference of the patients between the two groups was visualized (D). The RNA level of the 11 pyroptosis-related lncRNAs in the training set was visualized (E).

