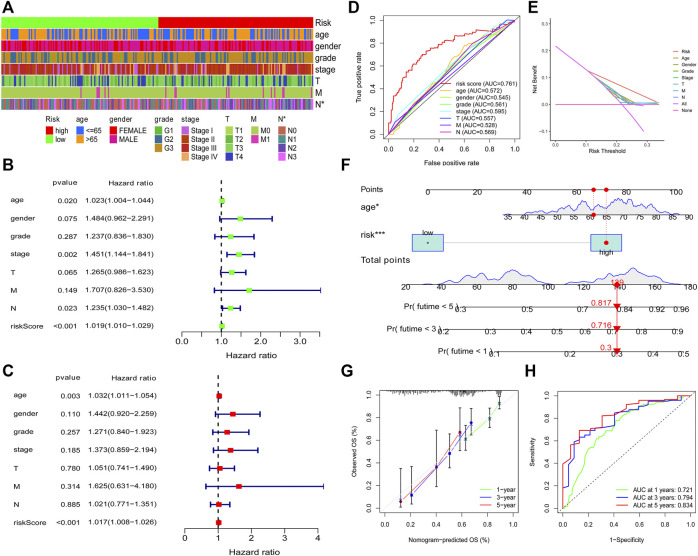
FIGURE 5.
Clinical application of the risk model. Correlation between the risk model and the clinicopathological characteristics of GC patients (A). Univariate analysis and multivariable analysis were conducted to verify the independent prognosis function of the model (B, C). ROC and DCA curves were performed to confirm the superiority of the risk score in clinical application (D, E). The nomogram was plotted to obtain the predicting survival time of GC patients (F). A calibration curve was utilized to assess the accuracy of the model in predicting patients’ survival time (G). The AUC value of the nomogram (H).

