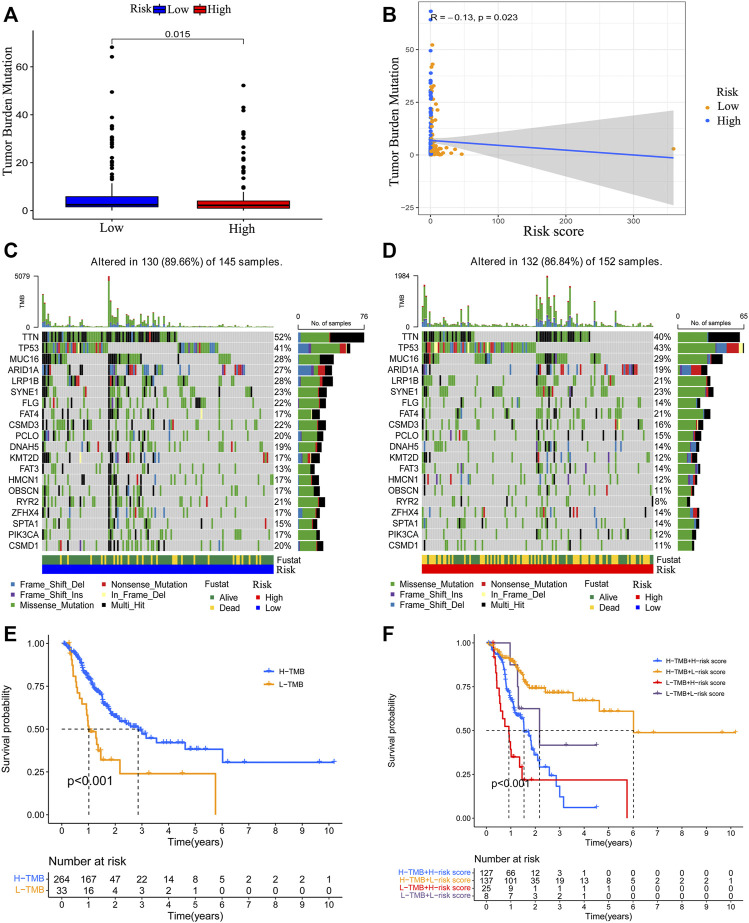
FIGURE 9.
Correlation between the risk model and TMB level. The relationship between risk score value and TMB level (A, B). The top 20 genes’ TMB status were visualized in two groups (C, D). The survival outcome of the patients with different TMB levels (E). The survival outcome of patients with low or high TMB level and lower risk score value or higher risk score value (F).

