FIGURE 11.

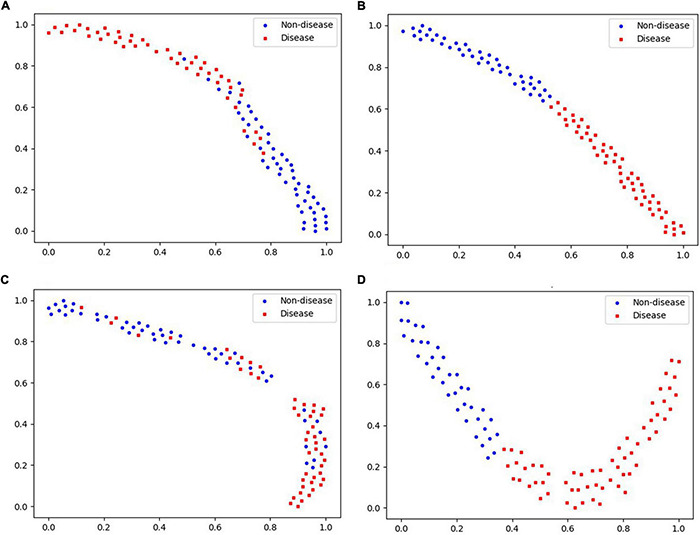
Visualization of “Pulse” data based on different classifiers. (A) Logistic regression. (B) Neural network. (C) Random forest. (D) SVM.

Visualization of “Pulse” data based on different classifiers. (A) Logistic regression. (B) Neural network. (C) Random forest. (D) SVM.