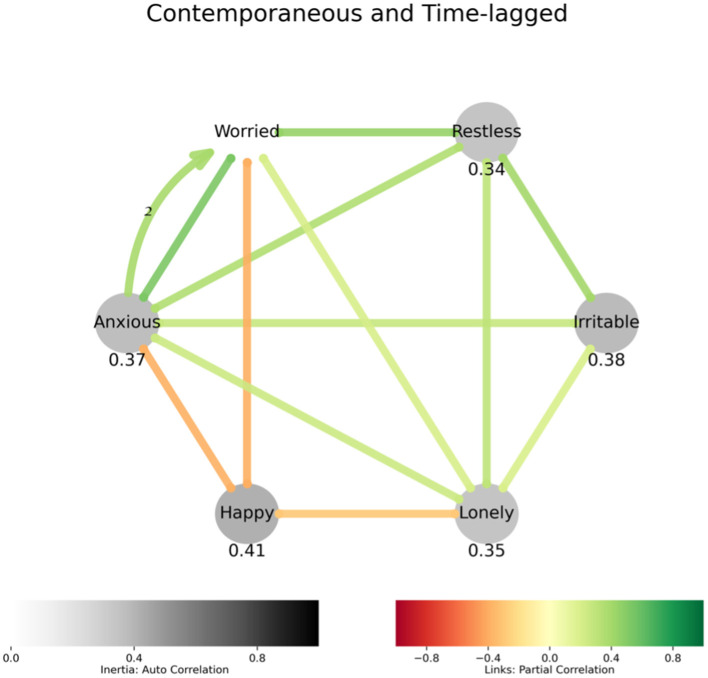
Figure 1.
Affect model describing how loneliness relates to affect: Undirected straight edges between variables indicate contemporaneous associations, and the directed labeled arcs represent lagged associations, with the label being the lag in multiples of sampling interval. The colors of the edges and the arcs represent negative (red) or positive (green) association. The variables with gray nodes indicate significant autocorrelation, or inertia, which can be interpreted as the values of these variables showing high resistance to change. If a variable measures polar quantity (happy-sad or relaxed-anxious), the variable is represented in the graph by the label to which higher values are assigned, and “how happy vs. sad were you” is simply “Happy.” Positive associations are in shades of green, and negative in shades of red. Lagged links are curved, have arrowheads and display lag in multiples of 8 h. Negative emotional states are associated with loneliness. Inverse relationship between happy and loneliness is also expected. Anxiety and worry display a positive feedback loop.

