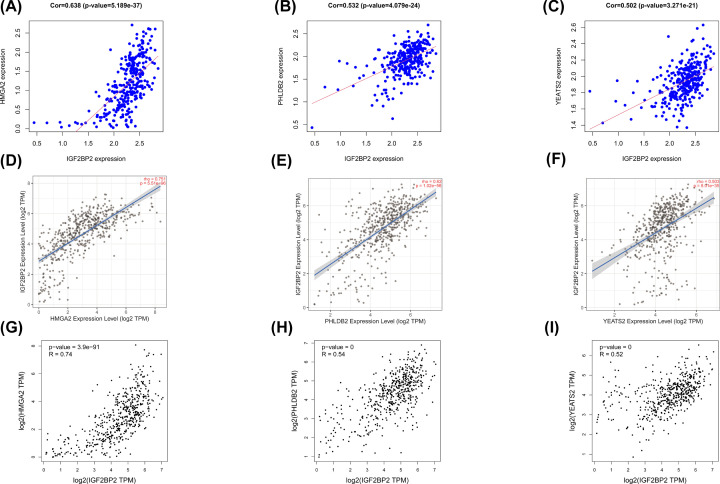
Figure 9. A filter of the top three significant genes that were positively associated with IGF2BP2.
(A–C) The genes positively associated with IGF2BP2 in OSCC (absolute Pearson’s r ≥ 0.5) were assessed with the TCGA database. (D–F) IGF2BP2 was significantly correlated with HMGA2 (cor = 0.751, P=5.51e−96), PHLDB2 (cor = 0.62, P=1.02e−56), YEATS2 (cor = 0.503, P=8.01e−35) in OSCC (via analysis in the TIMER database). (G–I) IGF2BP2 was significantly correlated with HMGA2 (cor = 0.74, P=3.9e−91), PHLDB2 (cor = 0.54, P<0.001), YEATS2 (cor = 0.52, P<0.001) in OSCC (via analysis in the GEIPA database).

