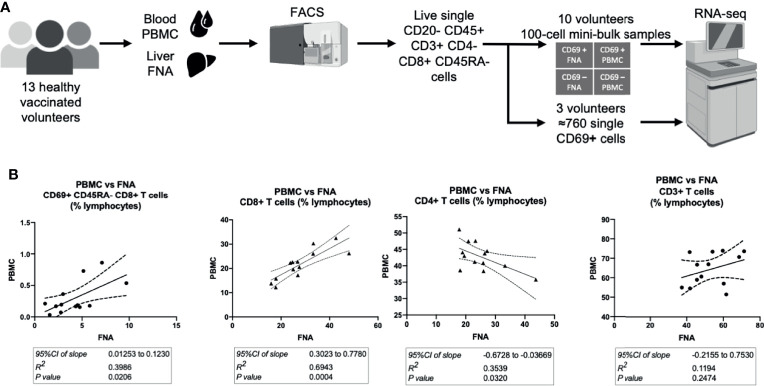
Figure 1.
Hepatic and circulating lymphocytes correlate numerically and phenotypically when analysed by flow cytometry. (A) Sampling workflow. 15 volunteers across all vaccination groups were recruited for liver FNA sampling. Two volunteers were unable to provide samples, due to logistical reasons, and withdrew on the sampling days. Hepatic fine needle aspirate and peripheral venesection were performed within one hour. Lymphocytes were isolated, stained for flow cytometry/cell sorting and sorted within three hours of sampling. Ten volunteers’ FNA and PBMC samples were two-way sorted for 100-cell mini-bulk RNA-sequencing and three volunteer samples were sorted for single-cell RNA-sequencing. (B) Quantitative correlations between liver and blood samples. The 95%CI of linear regression slope, R2 value of goodness of fit and the p value that the slope is significantly non-zero are presented below the respective plots. The P values were calculated by F tests. All plots are derived from 13 matched FNA and PBMC samples. All values are presented as a proportion of single CD45+ lymphocytes in each sample. FNA, fine needle aspirate. PBMC, peripheral blood mononuclear cells. tSNE, t-distributed stochastic neighbour embedding. CI, confidence interval. FNA, fine needle aspirate. GMFI, geometric mean fluorescence intensity. PBMC, peripheral blood mononuclear cells. tSNE, t-distributed stochastic neighbour embedding.

