Figure 2.
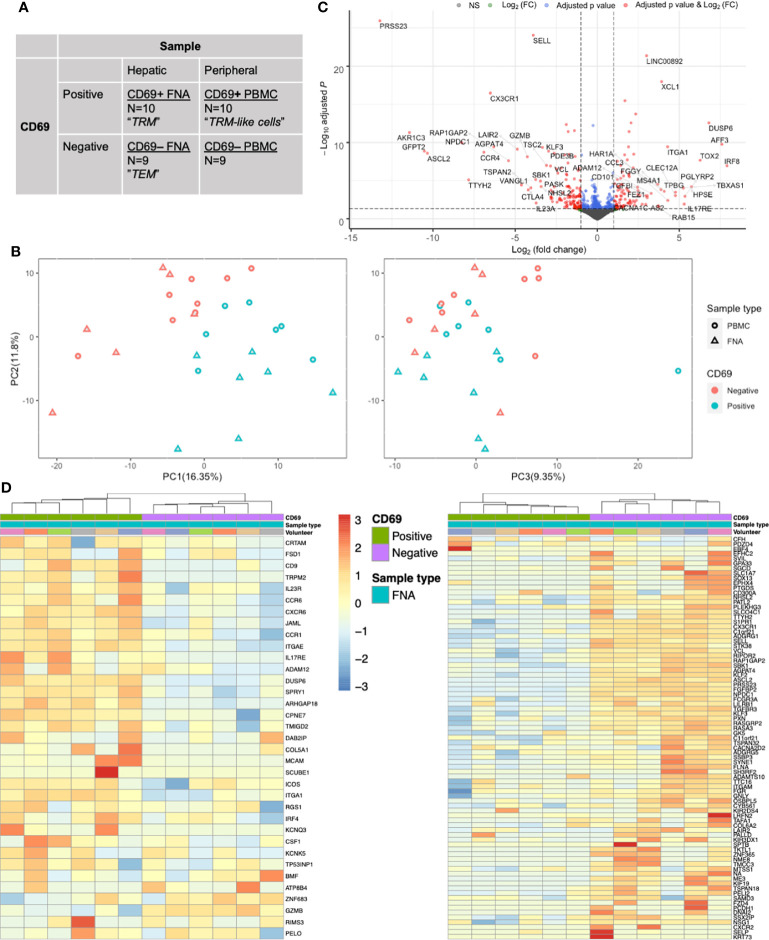
CD69 status is a major driver of transcriptional differences in memory CD8+ T cells as assessed by mini-bulk RNA-seq. (A) Mini-bulk RNA-seq experimental design. Each category was composed of N number of 100-cell samples pre-gated on live single CD20- CD45+ CD3+ CD4- CD8+ CD45RA- cells sequenced in bulk by the SmartSeq2 protocol. Two volunteers’ samples and one FNA paired (CD69+ and CD69-) samples were removed during QC. Non-normalised counts were input to DESeq2 and samples were paired according to volunteer and sample type. Differential expression analyses used a generalised linear model where counts were modelled using a negative binomial distribution. The Wald test was the default used for hypothesis testing when comparing gene expression between two sets of paired variables. See Figure 1A for sampling workflow. (B) PCA plots based on the 500 most variable genes by mini-bulk RNA sequencing. Plots of the first three PC, coloured according to CD69 status and sample type of the sequenced cells. Separation of CD69+ and CD69- cells was a composite of PC1 and PC2. PC3 does not distinguish CD69 status. Twenty-eight samples were analysed. (C) Volcano plot of up- and down-regulated genes between paired FNA CD69+ samples and CD69- samples. The top 50 up- and down-regulated genes have been annotated. Positive log(FC) values indicate greater gene expression in CD69+ samples, compared to CD69- samples. Negative log(FC) values indicate greater gene expression in CD69- samples. Differential expression of the 12,515 genes was tested for significance using the Wald test. P values were adjusted using the Benjamini-Hochberg (false discovery rate) correction. (D) Gene heatmap of FNA samples using the core TRM cell transcriptional signature described by Kumar et al. Left, heatmap of genes that are upregulated in the CD8+ Kumar et al. core transcriptional signature. Right, heatmap of genes that are downregulated in the CD8+ Kumar et al. core transcriptional signature. Columns are clustered based on Spearman’s correlation of rlog normalised count values. Rows are clustered according to Pearson correlation of the rlog normalised gene counts. Gene count values are centred and scaled across rows. FACS, fluorescence-assisted cell sorting; FC, fold change; FNA, fine needle aspirate; PBMC, peripheral blood mononuclear cells; PC, principal component; PCA, principal component analysis; QC, quality control; TEM, effector memory T cell; TRM, tissue-resident memory T cell.

