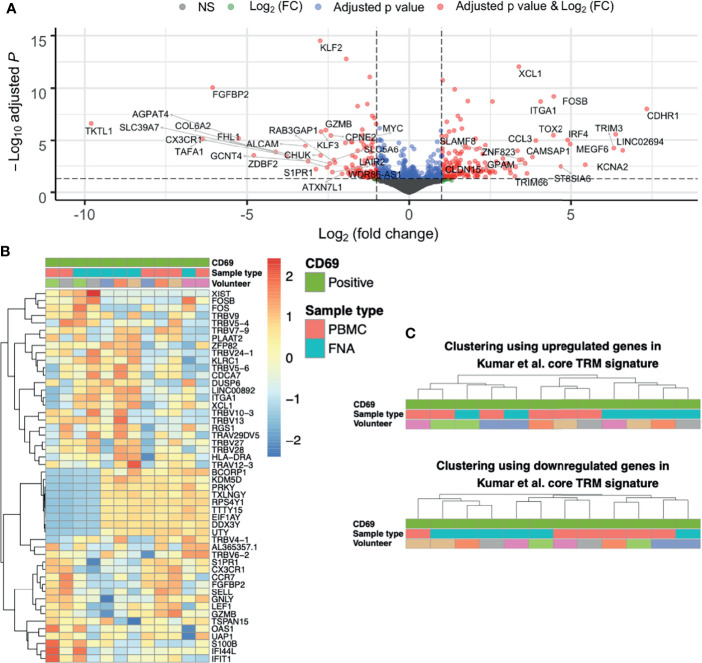
Figure 3.
The differences between CD69+ CD8+ T cells isolated from liver and blood are unique and not like those when comparing TRM and TEM cells. (A) Volcano plot of up- and down-regulated genes between paired FNA CD69+ and PBMC CD69+ samples. The top 50 up- and down-regulated genes have been annotated. Positive log(FC) values indicate greater gene expression in FNA CD69+ samples, compared to PBMC CD69+ samples. Negative log(FC) values indicate greater gene expression in PBMC CD69+ samples. DGE of 11,933 genes was tested for significance using the Wald test. P values were adjusted using the Benjamini-Hochberg correction (false discovery rate). (B) Heatmap of the most variable genes in the FNA CD69+ vs PBMC CD69+ comparison. Fifty most variable genes between FNA CD69+ and PBMC CD69+ samples. Yellow/red corresponds to increased counts compared to other samples and blue corresponds to decreased counts. Genes selected according to those with the greatest variance across samples. Columns are clustered based on Spearman’s correlation of rlog normalised count values. Rows are clustered according to Pearson correlation of the rlog normalised gene counts. Gene count values are centred and scaled across rows. (C) Clustering of FNA and PBMC CD69+ samples using expression of TRM cell genes. Hierarchical clustering trees based on Spearman’s correlation of sample rlog normalised count values considering up- and down-regulated genes in CD8+ Kumar et al. core TRM cell transcriptional signature. FC, fold change; FNA, fine needle aspirate; PBMC, peripheral blood mononuclear cells; rlog, regularised logarithm; TRM, tissue-resident memory T cell.

