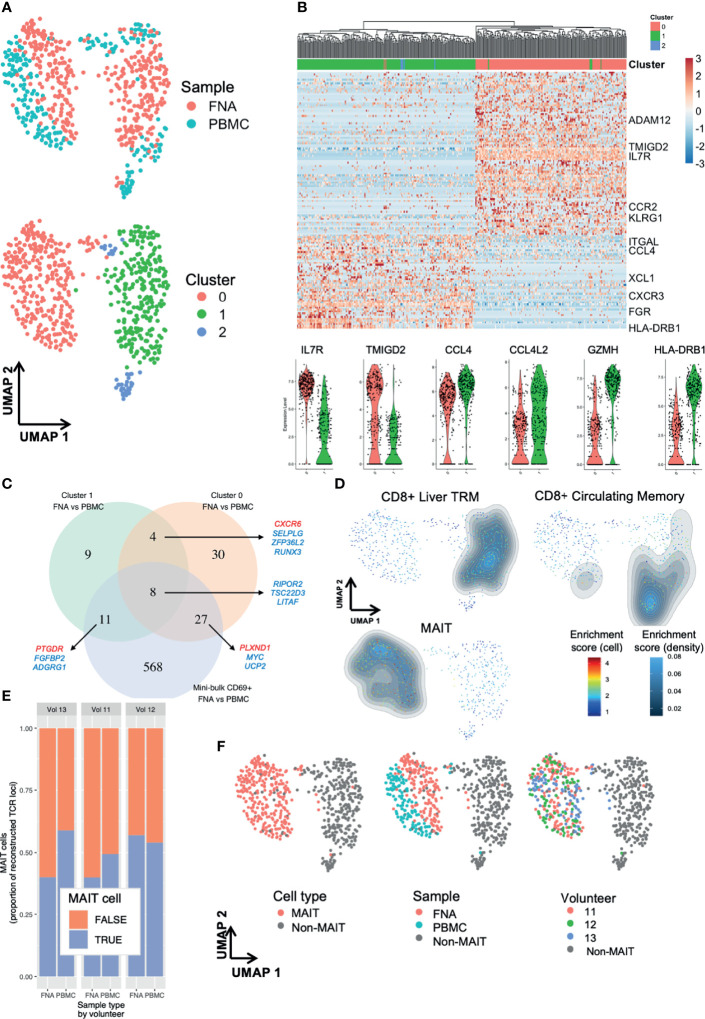
Figure 5.
Single-cell RNA-sequencing reveals subpopulations of liver TRM and blood TRM-like cells. Single cell differences between TRM and TRM-like cells depend on TRM cell cluster. (A) UMAP plots of 629 single cells. Plots according to sample type and Seurat cluster. Seurat FindClusters was run at 0.4 resolution. Each point represents one cell, either a PBMC or FNA live single CD20- CD3+ CD45+ CD8+ CD4- CD45RA- CD69+ lymphocyte FACS sorted and sequenced by the SmartSeq2 protocol. Six hundred and twenty-nine cells are presented in these plots. (B) Gene heatmap of the C1 TRM vs C0 TRM cell comparison. Cell gene count is centred and scaled across all row values. A sample of genes are shown, a full list of the 142 genes differentially expressed between C1 and C0 TRM cells is available in the source data file. All genes shown here were present in at least 50% of cells in each cluster, had |ln(FC)|>0.5 and an adjusted p value (Bonferroni correction)<0.05. The row hierarchical clustering dendrogram is based on Euclidean distances of cell gene count values considering all genes. Violin plots of gene expression of six selected genes are presented below. The violin colour corresponds to FNA cell cluster of origin, as seen in (A, C) Venn diagram of genes differentiating TRM and TRM-like cells. Venn diagram demonstrating the degree of convergence of cluster-level DGE and mini-bulk-level DGE. All included genes from single cell contrasts had a |ln(FC)|>0.25 and an adjusted p value (Bonferroni correction)<0.05 and the genes from mini-bulk contrasts had |log2(FC)|>1 and an FDR < 0.05. DGE, differential gene expression. The mini-bulk contrast refers to that which is presented in Figures 3 , 4 . A sample of the genes that are shared among the datasets is illustrated; blue indicates the gene is down-regulated in FNA CD69+ cells and red indicates the gene is up-regulated in FNA CD69+ cells, compared to blood CD69+ cells. (D) UMAP plots with signature enrichment scores. The enrichment of three signatures was assessed for each of the 629 cells and visualised in the UMAP by Single-Cell Signature Explorer (44). The per-cell signature enrichment was plotted, and density distribution of scores was overlaid. The signature scores represent a qualitative measure for visualisation. The signatures were obtained from Zhao et al. (22). (E) Proportion of recombinants that were derived from MAIT cells. MAIT cells were defined based on TCR α locus: any cell that expressed TRAV1-2 paired with TRAJ33, TRAJ12 or TRAJ20 was defined as a MAIT cell, regardless of the TCR β locus recombinant, if present. Any recombinant derived from a MAIT cell was labelled as such and excluded from non-MAIT cell analyses. (F) UMAP of 629 single cells with plots according to cluster, MAIT cell TCR, sample type and volunteer. In all plots, grey points (“non-MAIT”) represent cells that were either not classified as MAIT cells or cells for which TCR reconstruction could not be performed. Seurat FindClusters was run at 0.4 resolution, using a shared nearest neighbour clustering method. C, cluster; DGE, differential gene expression; FACS, fluorescence-assisted cell sorting; FDR, false discovery rate; FNA, fine needle aspirate; PBMC, peripheral blood mononuclear cells; MAIT, mucosal-associated invariant T cell; TRM, tissue-resident memory T cell; UMAP, uniform manifold approximation and projection.

