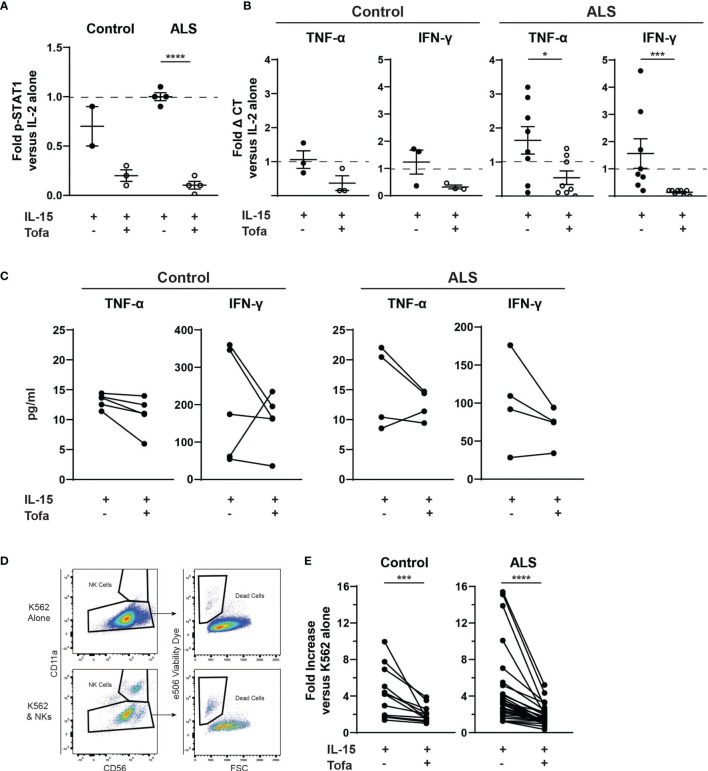
Figure 3.
Tofacitinib inhibits primary NK cells in vitro. Primary NK cells were enriched from the whole blood of control and ALS participants. (A) P-STAT1 was assessed using Western blot. Primary NK cells were incubated with IL-2 alone, IL-2 + IL-15, or IL-2 + IL-15 + tofacitinib for 2 hours. Protein extracts were resolved by SDS-PAGE and immunoblotted for total STAT1, phosphorylated STAT1 (P-STAT1), and α-tubulin (internal reference). Graph represents densitometric analysis where total STAT1 and P-STAT1 signals were normalized to α-tubulin then normalized to NK cells receiving IL-2 alone; n = 2-4 participants. (B) Cytokine gene expression was assessed using qRT-PCR for TNF-α and IFNγ. Data were normalized to yWHAZ expression and normalized to the IL-2 NK cells; n = 3-8 participants. (C) Extracellular expression of TNF-α and IFN-γ was assessed for primary NK cells cultured with IL-15 ± tofacitinib (n = 5 control and n = 4 ALS). (D) Primary NK cells were assessed for cytotoxicity. Primary NK cells were cultured for two hours with K-562 cancer cells (1:1 ratio) + IL-15 ± tofacitinib; K-562 cell death was assessed using flow cytometry to quantitate e506 viability dye fluorescence. (E) Data were quantitated by normalizing to K-562 cells cultured without NK cells; n = 12 control and n = 32 ALS. For (A, B), data are presented as mean ± SEM with dashed line showing cells cultures with IL-2 alone; comparisons were made by Student’s t-test. For (C), comparisons were made using a paired t-test. For (E), comparisons were made by Wilcoxon test to assessed paired, non-normally distributed data. *P < 0.05, ***P < 0.001, ****P < 0.0001.

