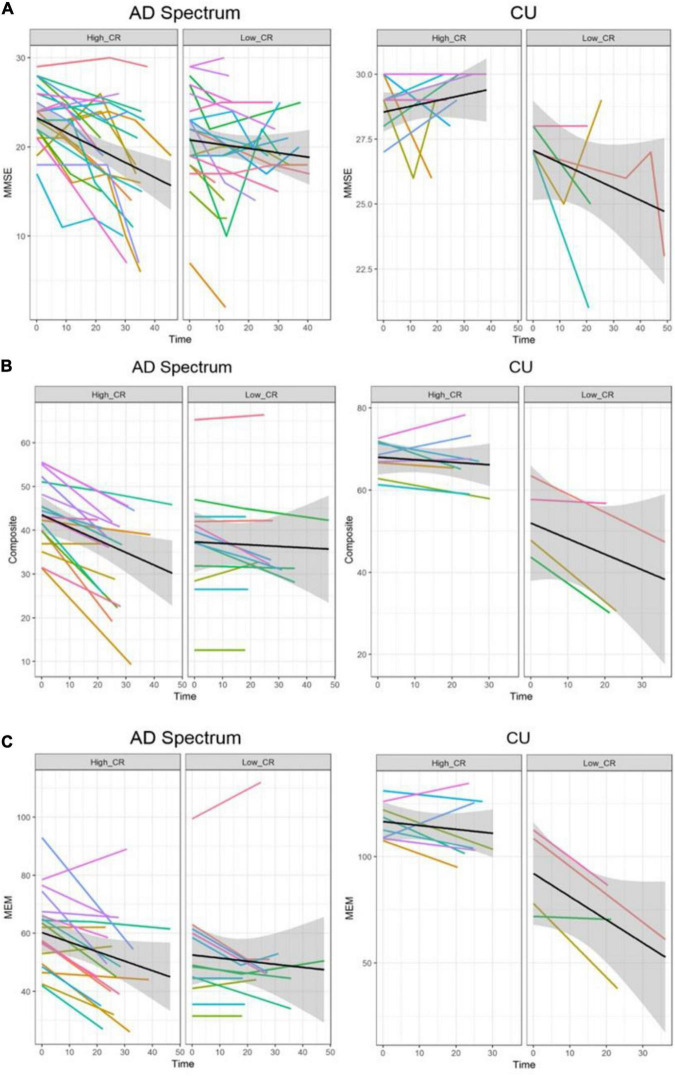
FIGURE 2.
Trajectories of cognitive decline according to the CR marker in AD spectrum and cognitively unimpaired group. Panels (A–C) represent the different cognitive scores. In each plot, X-axis: Time (month), Y-axis: each cognitive score, Left panel: high CR group, Right panel: low CR group. (A) Trajectories of MMSE according to the CR marker. (B) Trajectories of composite score according to the CR marker. (C) Trajectories of memory score according to the CR marker. In the AD spectrum, individuals with high CR showed a steeper decline than the low CR group. In contrast, individuals with high CR showed a attenuated decline than the low CR among the cognitively unimpaired group. Shadows in each plot indicate 95% confidence intervals. CU, cognitively unimpaired group; MMSE, Mini-Mental State Examination; Composite, cognitive composite score; MEM, memory function score.

