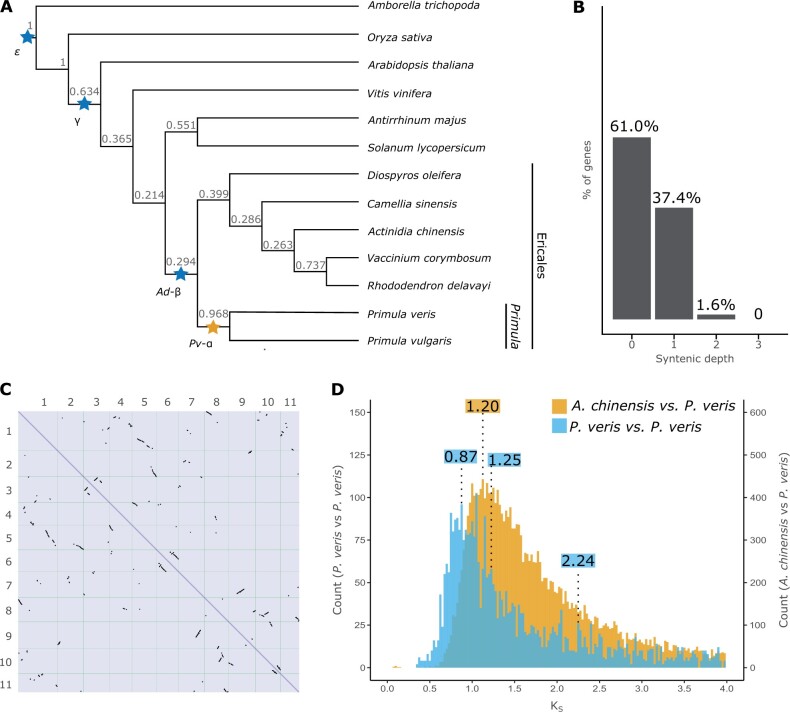
Fig. 3.
Evidence of a WGD in the Primula lineage. (A) Phylogeny of 13 angiosperm species inferred by OrthoFinder using the STAG algorithm and rooted using STRIDE; numbers at each node represent STAG support values, that is, the fraction of orthogroup trees supporting each bipartition (see Materials and Methods for details); WDGs inferred in previous studies are marked by blue stars; the yellow star represents a WGD newly demonstrated here. (B) Proportion of genes with different syntenic depths in the P. veris genome. (C) Dotplot obtained by aligning the P. veris maternal haplotype against itself; self-syntenic (i.e., duplicated) regions containing >5 collinear genes are represented by black marks. (D) Density distribution of KS in paralogous gene pairs within P. veris (blue) and in orthologous gene pairs between P. veris and A. chinensis (yellow), representing the sister clade of Primula; to ease visualization, the columns of the blue histogram were increased four times in height. The three statistically significant peaks in the blue distribution and the peak representing the divergence between P. veris and A. chinensis are marked with the respective KS values (in blue and yellow, respectively).

