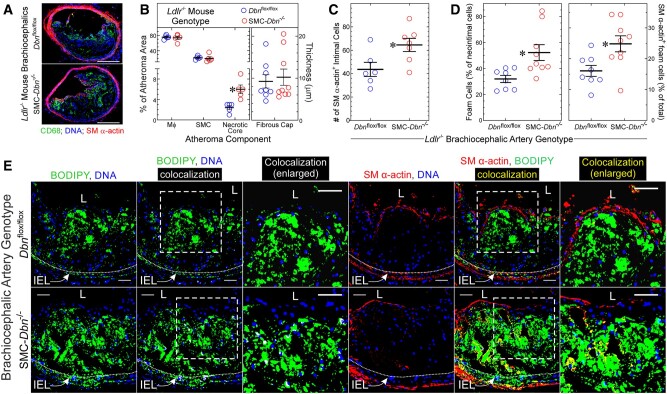
Figure 2.
SMC Drebrin deficiency augments atherosclerotic lesion necrotic core size and the prevalence of SMC-derived foam cells. (A) Brachiocephalic arteries from Dbnflox/flox/Ldlr−/− (control) and SMC-Dbn−/−/Ldlr−/− mice used in Figure 1 were immunostained with IgG specific for macrophages (CD68, green) and smooth muscle (SM) α-actin (red); all specimens were counterstained for DNA (blue). Serial sections stained with isotype control IgG yielded no green or red colour (not shown). Scale bars = 200 µm. (B) The percentages of atheroma area comprising macrophages, SMCs, and necrotic core were measured with ImageJ for five discrete mice of each group. The thickness of the atheroma SM α-actin+ fibrous cap was measured at six locations, which were averaged and plotted for each artery (n = 8–9), along with means ± SE for each genotype. Compared with control: *P < 0.01 (multiple t tests, Holm–Sidak correction for multiple comparisons). (C) SM α-actin-positive cells in each brachiocephalic atheroma were counted manually, and plotted with mean ± SE of 6–7 mice/genotype. Compared with control: *P < 0.03 (t test). (D, E) Serial sections of brachiocephalic arteries from A and B were incubated simultaneously with BODIPY® 493/503 (for cholesteryl ester), Hoechst 33342 (DNA), and either Cy3-conjugated IgG specific for SM α-actin or for no known protein. Confocal microscopy used an optical slice thickness of 1 µm. Serial sections stained with Cy3-control IgG yielded no red colour (not shown). The dotted white lines indicate the internal elastic lamina (IEL). The dashed boxes indicate areas enlarged further in the adjacent panels. L, lumen. Scale bars = 50 µm. Co-localization of green (BODIPY) with either blue (Hoechst) or red (SM α-actin) was performed using Imaris 9.2 software, to yield white or yellow, respectively. BODIPY-stained material in the neointima or media was judged to be cellular (as opposed to extracellular), and therefore foam cells, if there was co-localization of green BODIPY with blue DNA fluorescence (designated white). (D) Within several neointimal microscopic fields, the number of BODIPY+ (foam) cells (≥100 per artery) was divided by the total number of cells to obtain neointimal foam cell prevalence; the number of foam cells showing yellow SM α-actin co-localization was divided by the total number of neointimal foam cells to obtain ‘% of total foam cells’. Data were plotted for distinct brachiocephalic arteries from control (n = 8) and SMC-Dbn−/−/Ldlr−/− mice (n = 9), along with means ± SE. Compared with control: *P < 0.02 (t test).

