Figure 2.

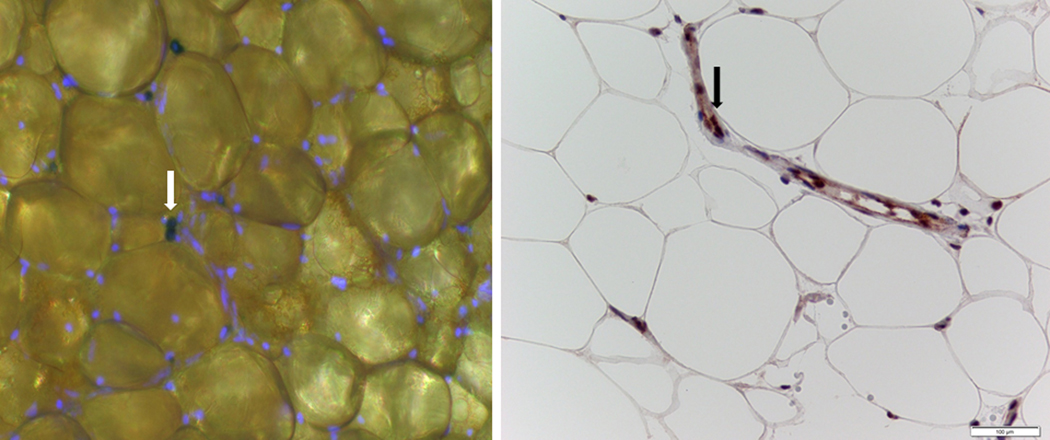
Left panel - fluorescent photomicrograph of adipose tissue (AT) stained for nuclei (blue) and β-galactosidase (white arrow) to identify senescent cells; right panel, photomicrograph of adipose stained for p16 (black arrow).

Left panel - fluorescent photomicrograph of adipose tissue (AT) stained for nuclei (blue) and β-galactosidase (white arrow) to identify senescent cells; right panel, photomicrograph of adipose stained for p16 (black arrow).