
Figure 5.
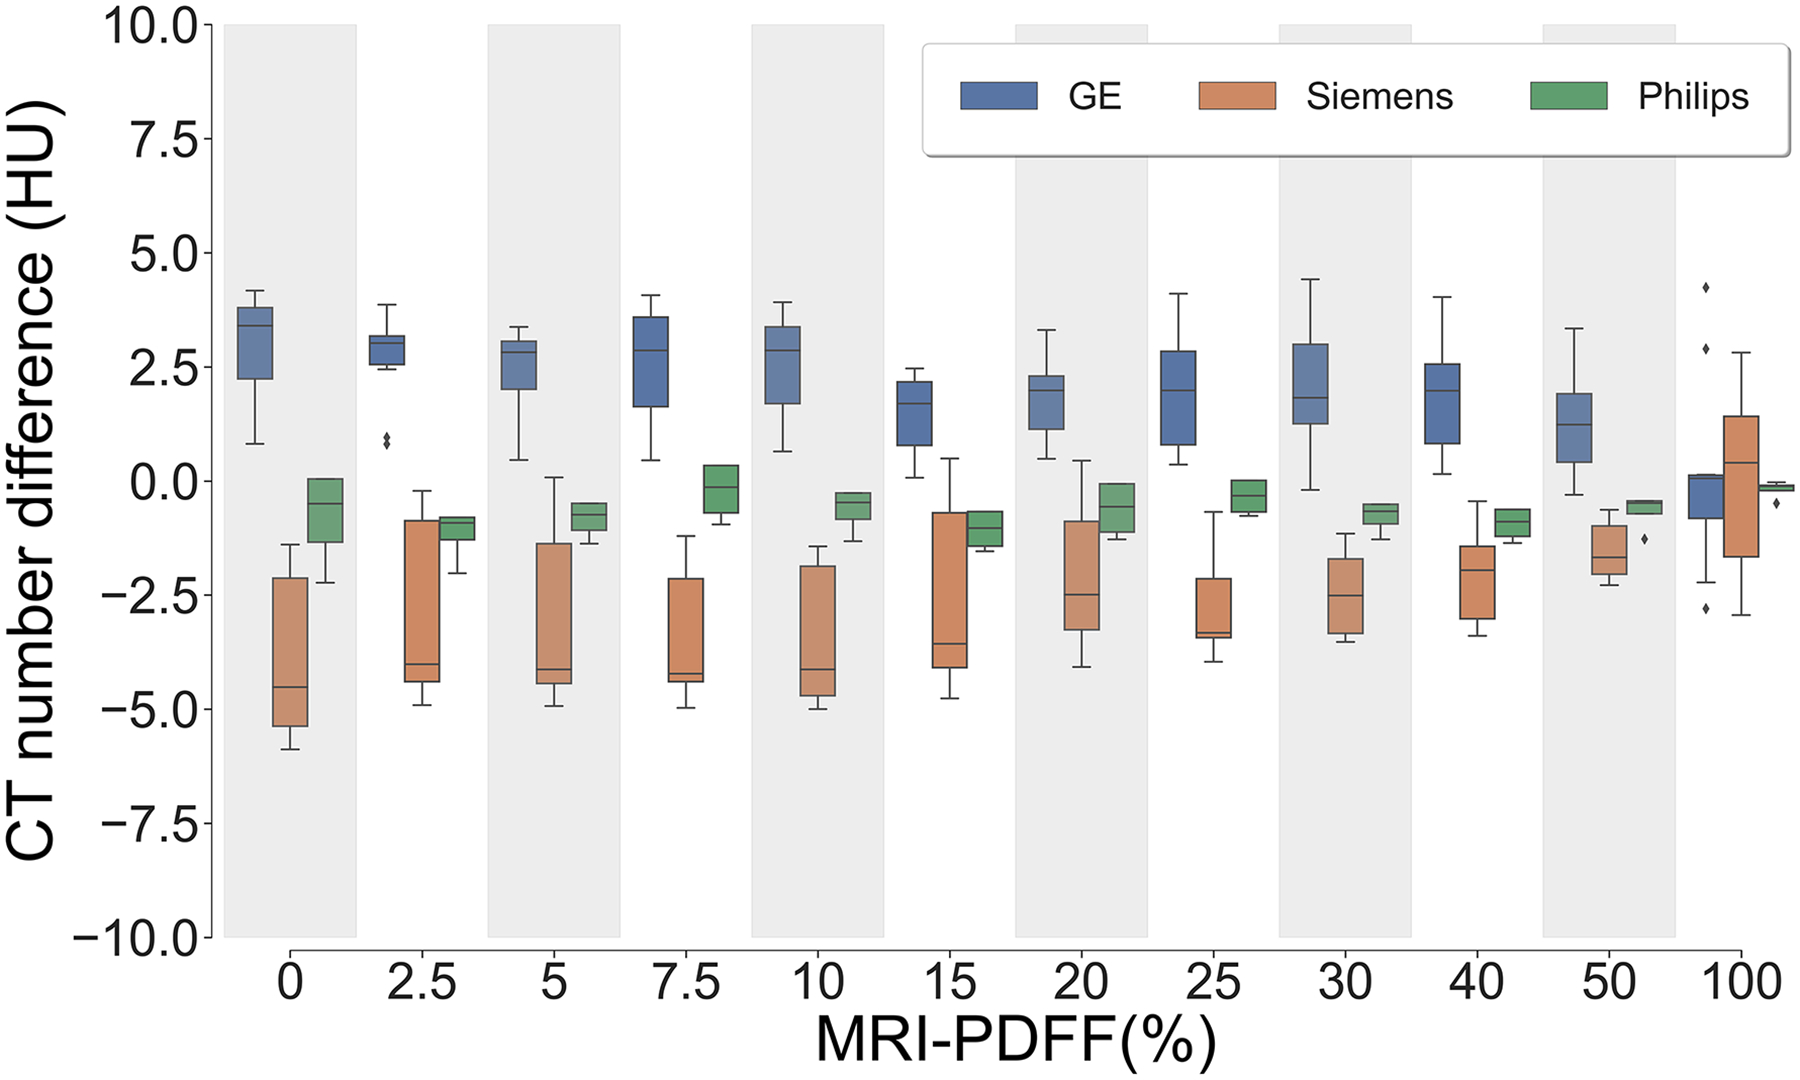
CT number difference (i.e., the difference between CT measurement from each acquisition and the averaged CT measurement from all acquisitions) were compared between vendors, across different PDFF levels. The CT number difference from all vendors fall within a range of −5 to 5 HU across all MRI-PDFF levels. Note that the standard deviation of CT number difference depends on the quantity of scanners for each vendor. PDFF, proton density fat-fraction.