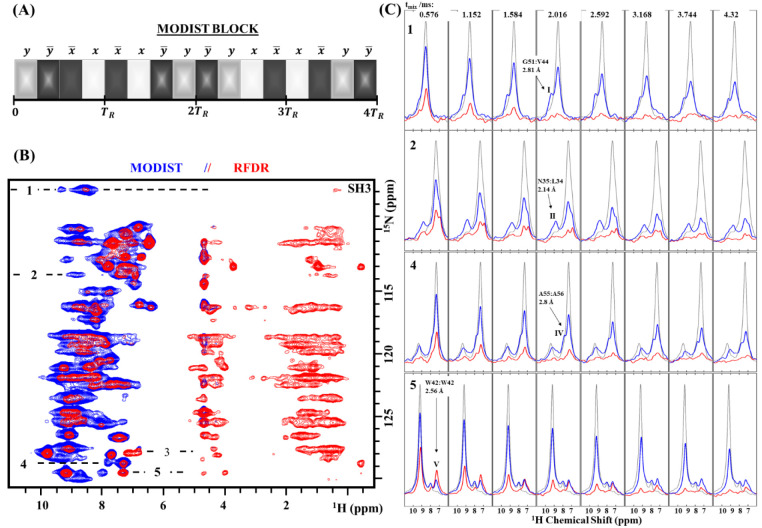
Figure 1.
Comparison of RFDR and MODIST transfers in 2D (H)N(H)H spectra of microcrystalline SH3. (A) The MODIST pulse sequence −16 π/4 pulses with the phase cycle yy̅x̅xx̅xy̅yy̅yxx̅xx̅yy̅ occupy four rotor periods (TR). (B) (H)N(H)HMODIST (blue) and (H)N(H)HRFDR (red) spectra (1.152 ms mixing). (C) Four slices from (H)N(H)HRFDR (red) and (H)N(H)HMODIST (blue) spectra, recorded at eight different mixing times (in ms): 0.576, 1.152, 1.584, 2.016, 2.592, 3.168, 3.744, and 4.32, as labeled. The chemical shifts of peaks I–V are (15N in ppm/1H in ppm): I, (106.8/9.35); II, (113.7/8.74); IV, (128.7/7.8); V, (129.4/7.34). The (H)NH reference spectrum is shown in gray. The proton carrier was set to 8.2 ppm for the mixing. Data were recorded from an 800 MHz spectrometer with 55.555 kHz MAS. XY8 phase cycling was used for RFDR. The full experimental details are given in the Supporting Information.

