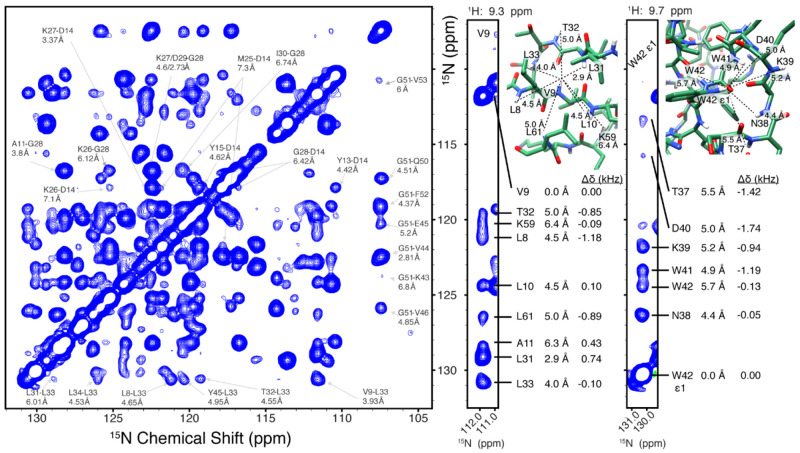
Figure 2.
15N–15N projection of the 3D (H)N(H)(H)NHMODIST spectrum (6.48 ms mixing) recorded at 1200 MHz with 55.555 kHz MAS. Two strips, extracted from the 3D at the proton frequencies of V9 and W42 ε1, are shown at the right, together with assignments for the observed correlations, internuclear distances, and isotropic chemical shift differences (Δδ). Distances were taken from the crystal structure of SH3 (PDB code 2NUZ). The proton carrier frequency was set to 3 ppm for the duration of mixing (further experimental details are given in the Supporting Information).

