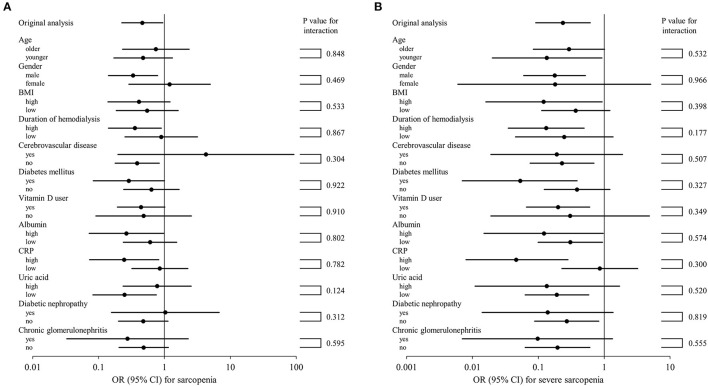
Figure 1.
Subgroup analysis of association of XOR inhibitor use with sarcopenia (A) and severe sarcopenia (B). Forrest plots showing OR (95% CI) in squares and lines for each category are presented. The 95% CI values shown were calculated within each category and p-values for subgroup analyses represent tests for interaction. The higher and lower groups were defined as greater and less than or equal to the median, respectively. BMI, body mass index; CRP, C-reactive protein; XOR, xanthine oxidoreductase; OR, odds ratio; CI, confidence interval.

