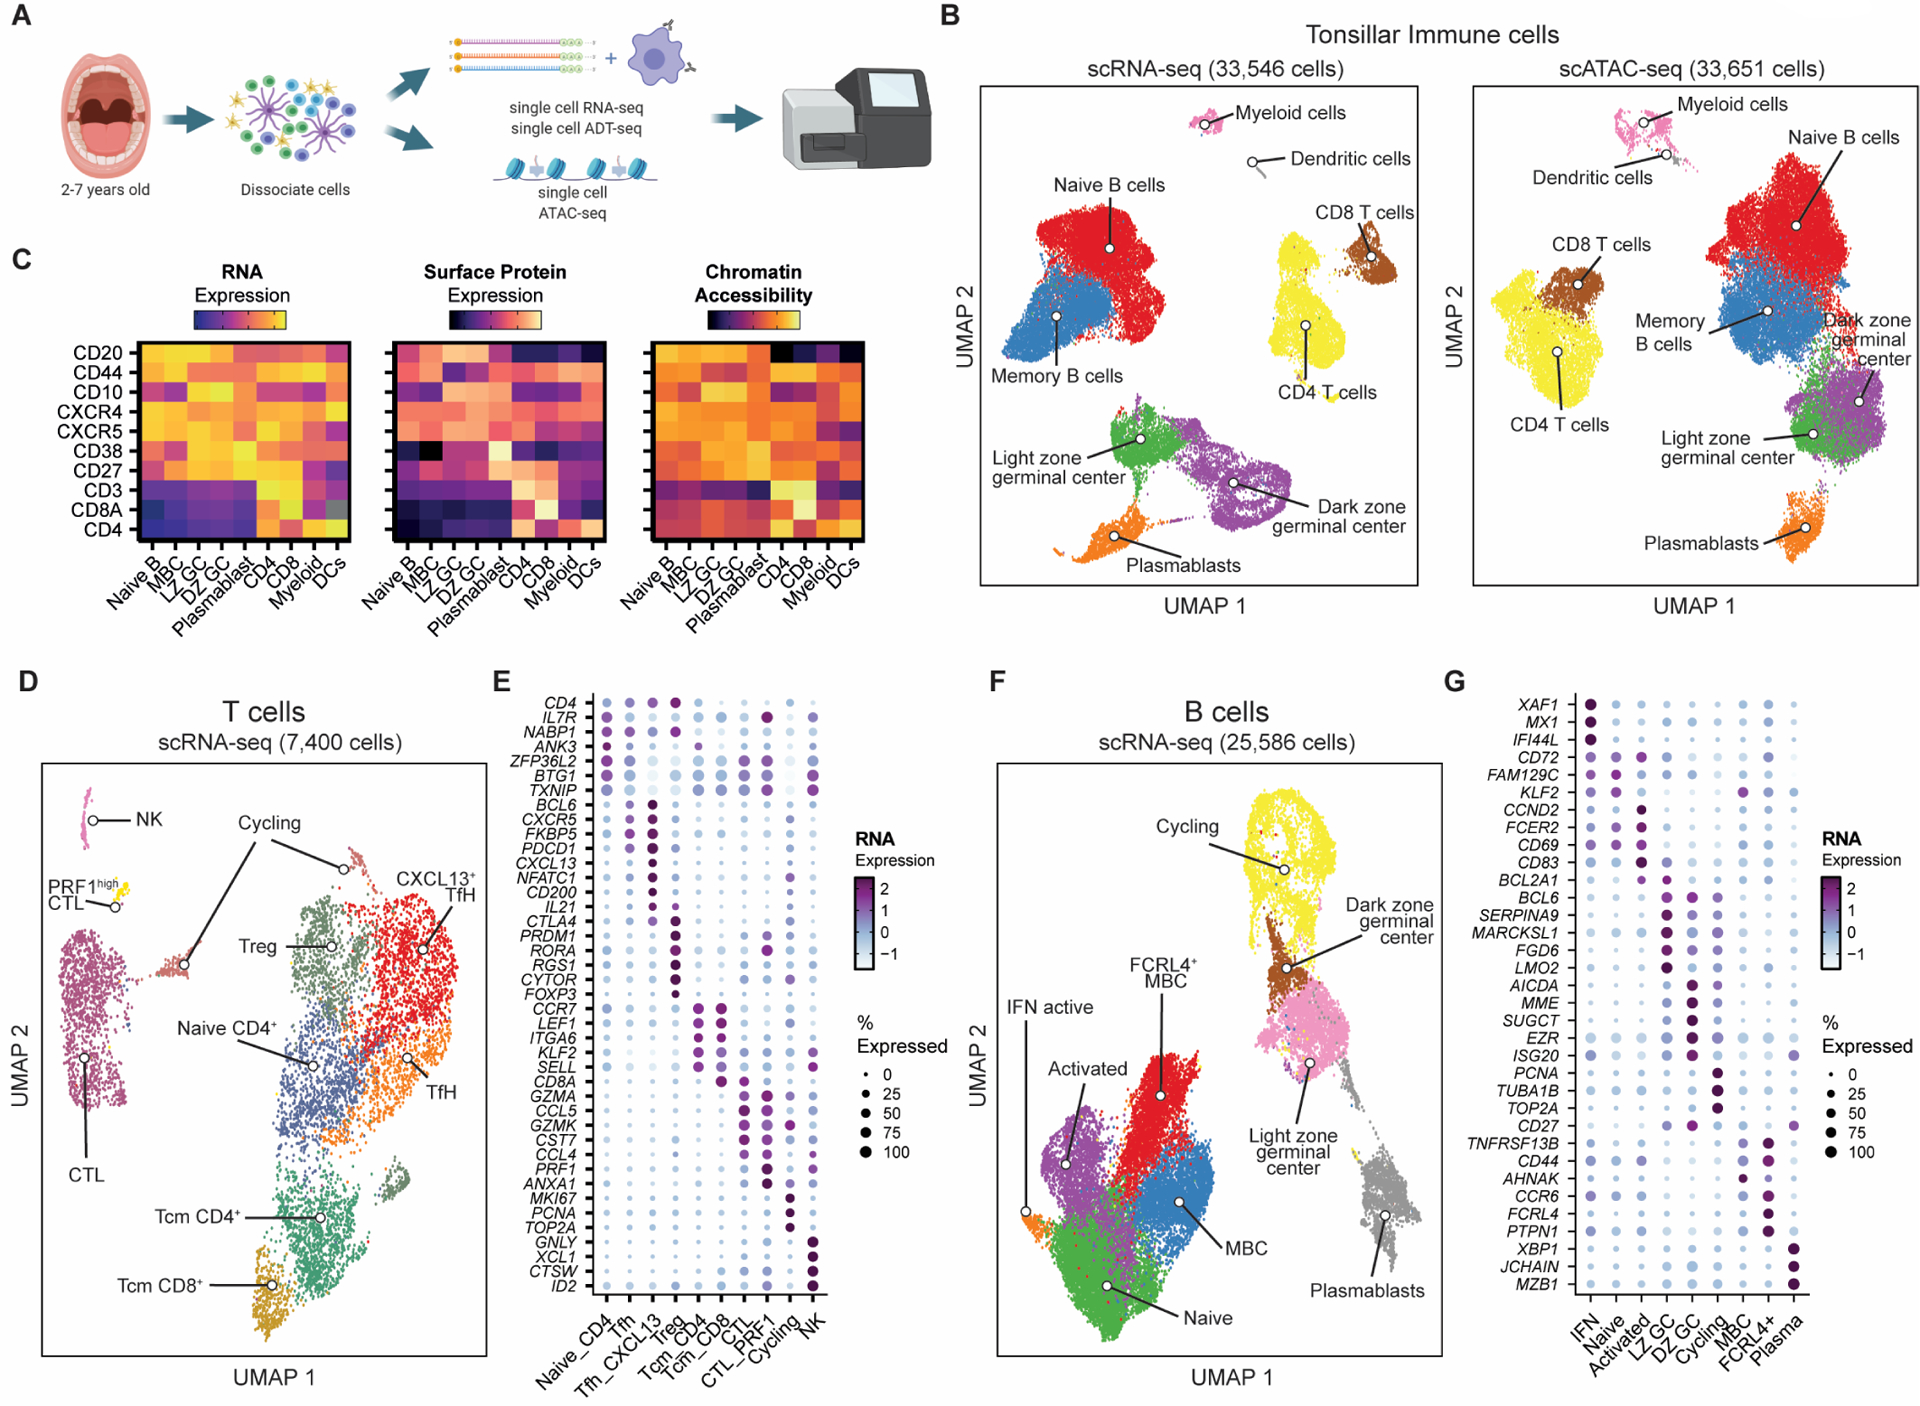
Figure 1. Single-cell mapping of immune cell subsets in human tonsils.

A) Experimental strategy for single-cell transcriptomics, surface marker expression, and chromatin accessibility of immune cells from pediatric tonsils.
B) UMAP of tonsillar immune scRNA-seq data (left; 3 donors) and scATAC-seq data (right; 7 donors).
C) Heatmap comparing gene expression, surface protein, and chromatin accessibility across immune cell types.
D) UMAP of T cell sub-populations in the tonsillar immune scRNA-seq data in B). NK = natural killer, CTL = cytotoxic lymphocyte, Treg = regulatory T cell, TfH = T follicular helper cell, Tcm = T central memory.
E) Mean expression of key marker genes for T cell sub-populations by scRNA-seq. Frequency of cells for which each gene is detected is denoted by size of the dots.
F) UMAP of B cell sub-populations in the tonsillar immune scRNA-seq data in B). MBC = memory B cell, LZ GC = light zone germinal center, DZ GC = dark zone germinal center; IFN = interferon.
G) Mean expression of key marker genes for B cell sub-populations by scRNA-seq. Frequency of cells for which each gene is detected is denoted by size of the dots.
