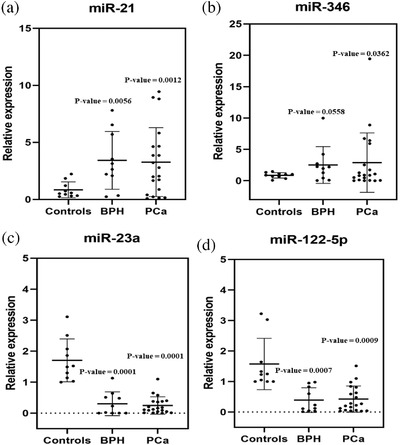
FIGURE 8.

Relative expression of miR‐21, miR‐346, miR‐23a, and miR‐122‐5p from EVs from BPH, PCa, and normal urine samples isolated by using LF‐bis‐MPA‐MNPs. (a) The relative expressions of miR‐21 from BPH and PCa urine samples were upregulated compared to the control group (p ≤ 0.05). (b) The relative expressions of miR‐346 from BPH and PCa urine samples were upregulated compared to the control group (p ≤ 0.05). (c) The relative expression of miR‐23a from BPH and PCa urine samples was downregulated compared to the control group (p ≤ 0.01). (d) The relative expression of miR‐122‐5p from BPH and PCa urine samples was downregulated compared to the control group (p ≤ 0.01) (n = 10 for BPH and n = 20 for PCa and n = 10 for healthy controls). The data were compared by using two‐tailed t‐tests
