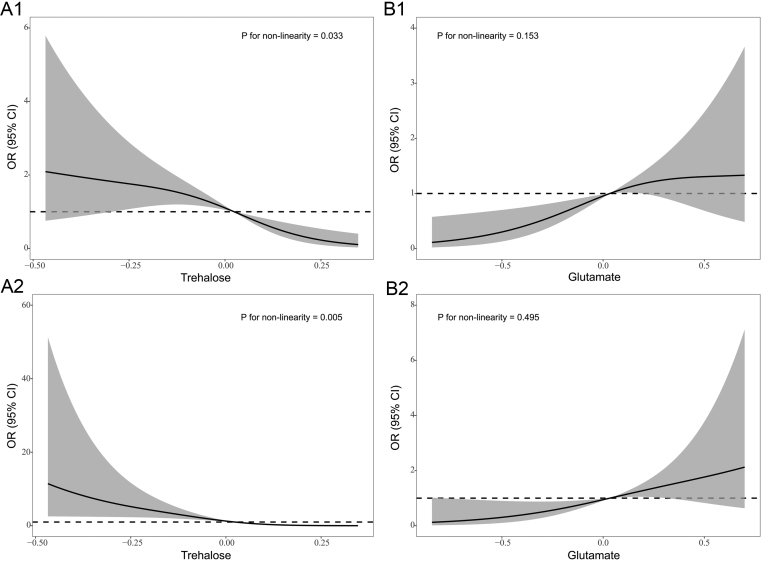
Figure 1.
Associations of standard-transformed trehalose (A) and glutamate (B) with the odds of diabetic retinopathy. (A1 and B1) adjusting for SBP and duration of diabetes; (A2 and B2) Adjusting for confounders screened by the LASSO regression model. Odds ratios and 95% CIs are indicated by solid lines and shaded areas, respectively. The intersection point of the solid line and dash line is the median of each metabolite, with knots of restricted cubic spline logistic regression model placed at 5th, 50th and 95th percentiles.

 This work is licensed under a