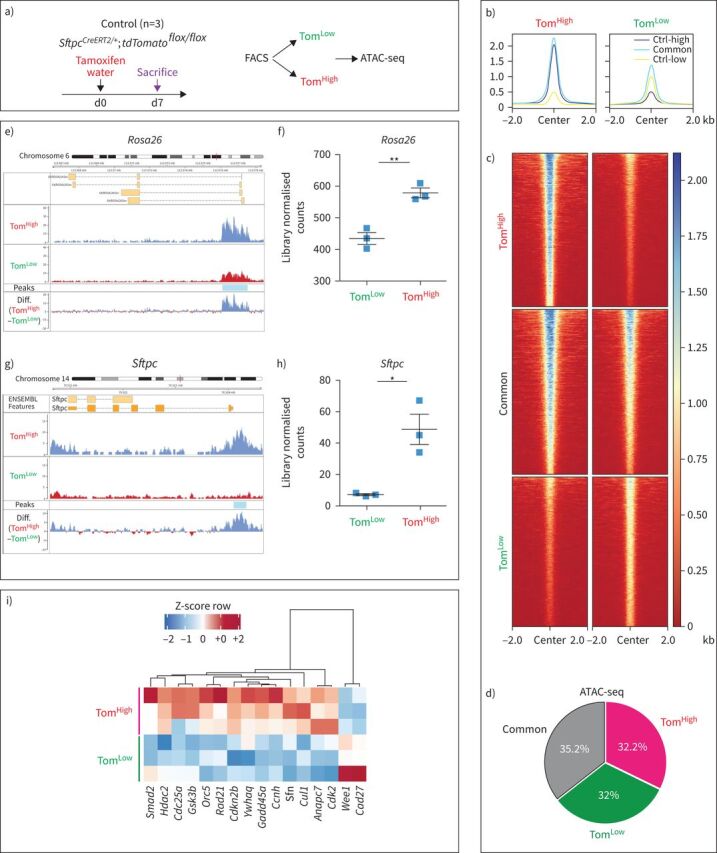
FIGURE 2.

Assay for transposase-accessible chromatin using sequencing (ATAC-seq) analysis on fluorescence-activated cell sorting (FACS)-based sorted tdTomatoLow (TomLow) and tdTomatoHigh (TomHigh) populations. a) Timeline of tamoxifen treatment of SftpcCreERT2/+;tdTomatoflox/flox mice (n=3). ATAC-seq was carried out on FACS-based sorted TomLow and TomHigh subpopulations. d: day. b, c) Coverage heat maps of TomLow and TomHigh, displaying genome-wide regions of differential open chromatin peaks in TomLow versus TomHigh. TomLow chromatin is less open and transcriptionally less active compared to TomHigh. Ctrl-low shows the peaks related to open chromatin regions in TomLow. Ctrl-high shows the peaks related to open chromatin regions in TomHigh. Common shows peaks detected in both TomLow and TomHigh subpopulations. d) ATAC-seq analysis of peaks based on the cut-offs shows 3605 upregulated in TomHigh (false discovery rate (FDR)<0.05, log2(FC)>0.585, base mean>20), 3512 upregulated in TomLow (FDR<0.05, log2(FC)>0.585, base mean>20) and 3878 non-regulated (base mean>20, FDR>0.5, log2(FC) between −0.15 and 0.15), which means 32% and 32.2% of the genome is differently accessible in TomLow and TomHigh, respectively. e) ATAC-seq histogram of average read coverage at the Rosa26 locus shows distinct ATAC-seq peaks at the promoter and denser chromatin in TomLow compared to TomHigh in this locus. Representative peaks of TomLow and TomHigh are the average of three independent samples. f) Quantification of peaks at the Rosa26 locus. g) ATAC-seq profile at Sftpc locus shows distinct ATAC-seq peaks at the promoter and denser chromatin in TomLow compared to TomHigh. Representative peaks of TomLow and TomHigh are averages of three independent samples. h) Quantification of peak regions of Sftpc locus. The ATAC-seq data have been normalised for sequencing depth and the scale on the y-axis was chosen for optimal visualisation of peaks. i) ATAC-Heat-pVAI Z-score, Pearson, average heat map based on the ATAC-seq data of top cell cycle-related genes differentially regulated in TomLow and TomHigh. FDR: the significance of results by Benjamini–Hochberg correction of multiple tests (n=3).
