
FIGURE 6.
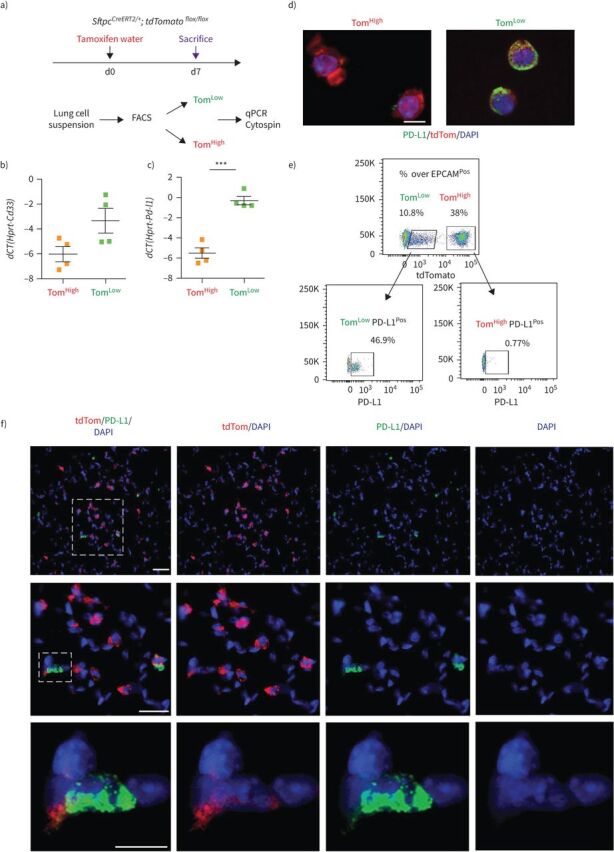
PD-L1 is a specific surface marker enriched in tdTomatoLow (TomLow) cells. a) Validation of gene array data by quantitative PCR (qPCR). d: day. b, c) Quantification of the expression levels of Cd33 (b) and Pd-l1 (c) in TomLow compared to tdTomatoHigh (TomHigh). Data are presented as mean±sem. dCT: delta cycle threshold. ***: p<0.001. d) Representative PD-L1 immunofluorescence staining on TomLow and TomHigh cytospin cells. Scale bar: 50 μm. e) Representative flow cytometry analysis of PD-L1Pos population in TomLow and TomHigh. f) Representative PD-L1 immunofluorescence staining on the lung sections. Scale bar: 10 μm.