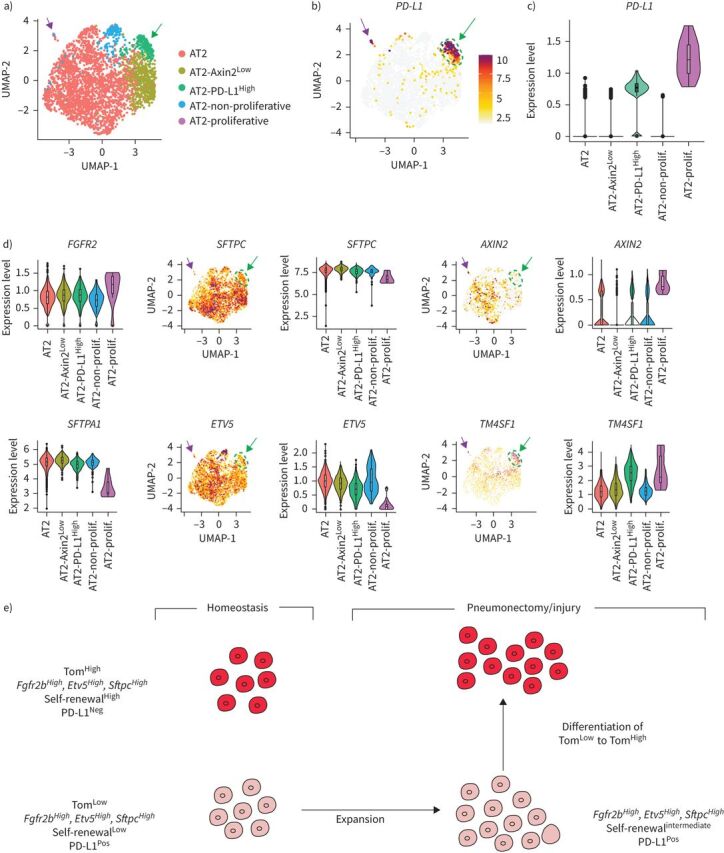
FIGURE 8.

Identification of PD-L1Pos cells in human AT2 single-cell RNA-sequencing (scRNA-seq) data set. a) UMAP plot of the initial AT2 cell cluster indicates the presence of five different AT2 sub-clusters. b) UMAP and c) violin plots showing PD-L1 enrichment in the AT2-PD-L1High sub-cluster. d) UMAP and violin plots showing that the AT2-PD-L1High sub-cluster displays low levels of ETV5, SFTPC and AXIN2 and high levels of TM4SF1. Green arrows indicate AT2 PD-L1High and lavender arrows indicate AT2-proliferative. e) Model for tdTomatoLow (TomLow) and tdTomatoHigh (TomHigh) cells in homeostasis and after pneumonectomy/injury. TomLow cells are quiescent in the adult lung during homeostasis but are activated after injury. They acquire proliferative capabilities and differentiate into mature AT2 cells.
