Table 3.
Biological Activity of Quinolone R2 Carboxylic Acids and Methyl Esters with R1 Substituted Pyridinesa
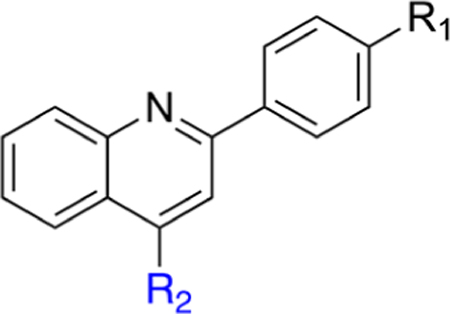
| |||||||
|---|---|---|---|---|---|---|---|
| DHODH Assay | MTT Assay |
||||||
| # | R1 | R2 | IC50 (μM) | cLogP | LipE | HCT-116 IC50 (μM) | MIA PaCa-2 IC50 (μM) |
|
| |||||||
| 22 |
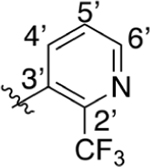
|
CO2H | 0.148 ± 0.021 | 5.14 | 1.69 | 4.63 ± 1.1 | 8.84 ± 3.8 |
| 23 |

|
CO2H | 1.43 ± 0.76 | 5.14 | 0.70 | 3.87 ± 1.0 | 8.71 ± 3.2 |
| 24 |

|
CO2Me | >50 | 5.37 | NA | NTb | NT |
| 25 |
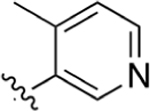
|
CO2H | 0.373 ± 0.22 | 4.46 | 1.97 | 10.8 ± 2.7 | 17.9 ± 5.9 |
| 26 |
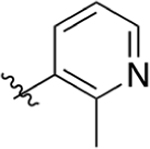
|
CO2H | 0.0221 ± 0.020 | 4.46 | 3.20 | 10.0 ± 0.85 | 18.2 ± 6.0 |
| 27 |

|
CO2H | 12.5 ± 1.1 | 4.40 | 0.50 | 16.8 ± 2.9 | > 100 |
| 28 |
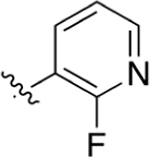
|
CO2H | 1.42 ± 0.37 | 4.40 | 1.45 | 11.2 ± 2.6 | 32.1 ± 24 |
| 29 |
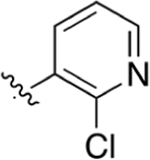
|
CO2H | 0.0327 ± 0.021 | 4.72 | 2.77 | 3.30 ± 0.75 | 7.13 ± 1.4 |
| 30 |
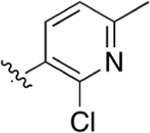
|
CO2H | 0.235 ± 0.11 | 5.22 | 1.41 | 5.13 ± 3.1 | 14.2 ± 7.3 |
| 31 |

|
CO2H | 8.4 ± 3.2 | 3.52 | 1.56 | > 100 | > 100 |
Data for cLogP values was predicted using ChemBioDraw Professional 16. Lipophilic ligand efficiency (LipE) calculated LipE = −pIC50 (M) – cLogP.33
NT, not tested.
