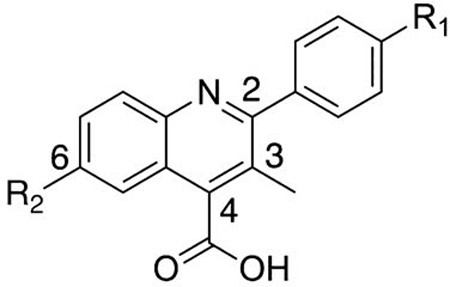
Table 5.
Biological Activity of R1/R2 Substituted Quinolinesa
| |||||||
|---|---|---|---|---|---|---|---|
| DHODH Assay | MTT Assay |
||||||
| # | R1 | R2 | IC50 (μM) | cLogP | LipE | HCT-116 IC50 (μM) | MIA PaCa-2 IC50 (μM) |
|
| |||||||
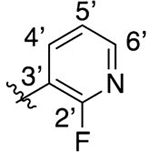
| 37 |
|
F | 0.0794 ± 0.044 | 4.45 | 2.65 | 5.71 ± 1.1 | 23.6 ± 28 |
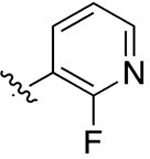
| 38 |
|
Cl | 0.165 ± 0.035 | 5.02 | 1.76 | 5.43 ± 2.1 | 14.7 ± 6.9 |
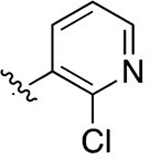
| 39 |
|
Me | 0.0542 ± 0.012 | 5.12 | 2.15 | 11.1 ± 0.38 | 8.29 ± 3.1 |
| 40 |
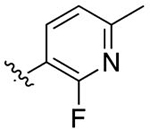
|
F | 3.31 ± 0.17 | 4.95 | 0.53 | 33.7 ± 0.41 | 33.8 ± 13 |
| 41 |
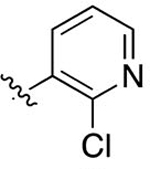
|
F | 0.00971 ± 0.0014 | 4.76 | 3.25 | 3.02 ± 0.35 | 7.18 ± 2.3 |
| 42 |
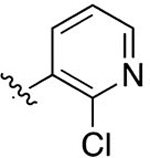
|
Cl | 0.0360 ± 0.0058 | 5.34 | 2.10 | 4.36 ± 0.94 | 4.73 ± 2.8 |
| 43 |
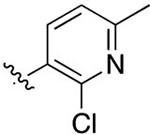
|
F | 0.0262 ± 0.0018 | 5.27 | 2.31 | 1.98 ± 1.3 | 6.57 ± 5.0 |
| 44 |
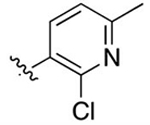
|
Cl | 0.0744 ± 0.028 | 5.84 | 1.29 | 2.71 ± 1.3 | 7.56 ± 4.3 |
Data for cLogP values was predicted using ChemBioDraw Professional 16. Lipophilic ligand efficiency (LipE) calculated LipE = −pIC50 (M) – cLogP.33
