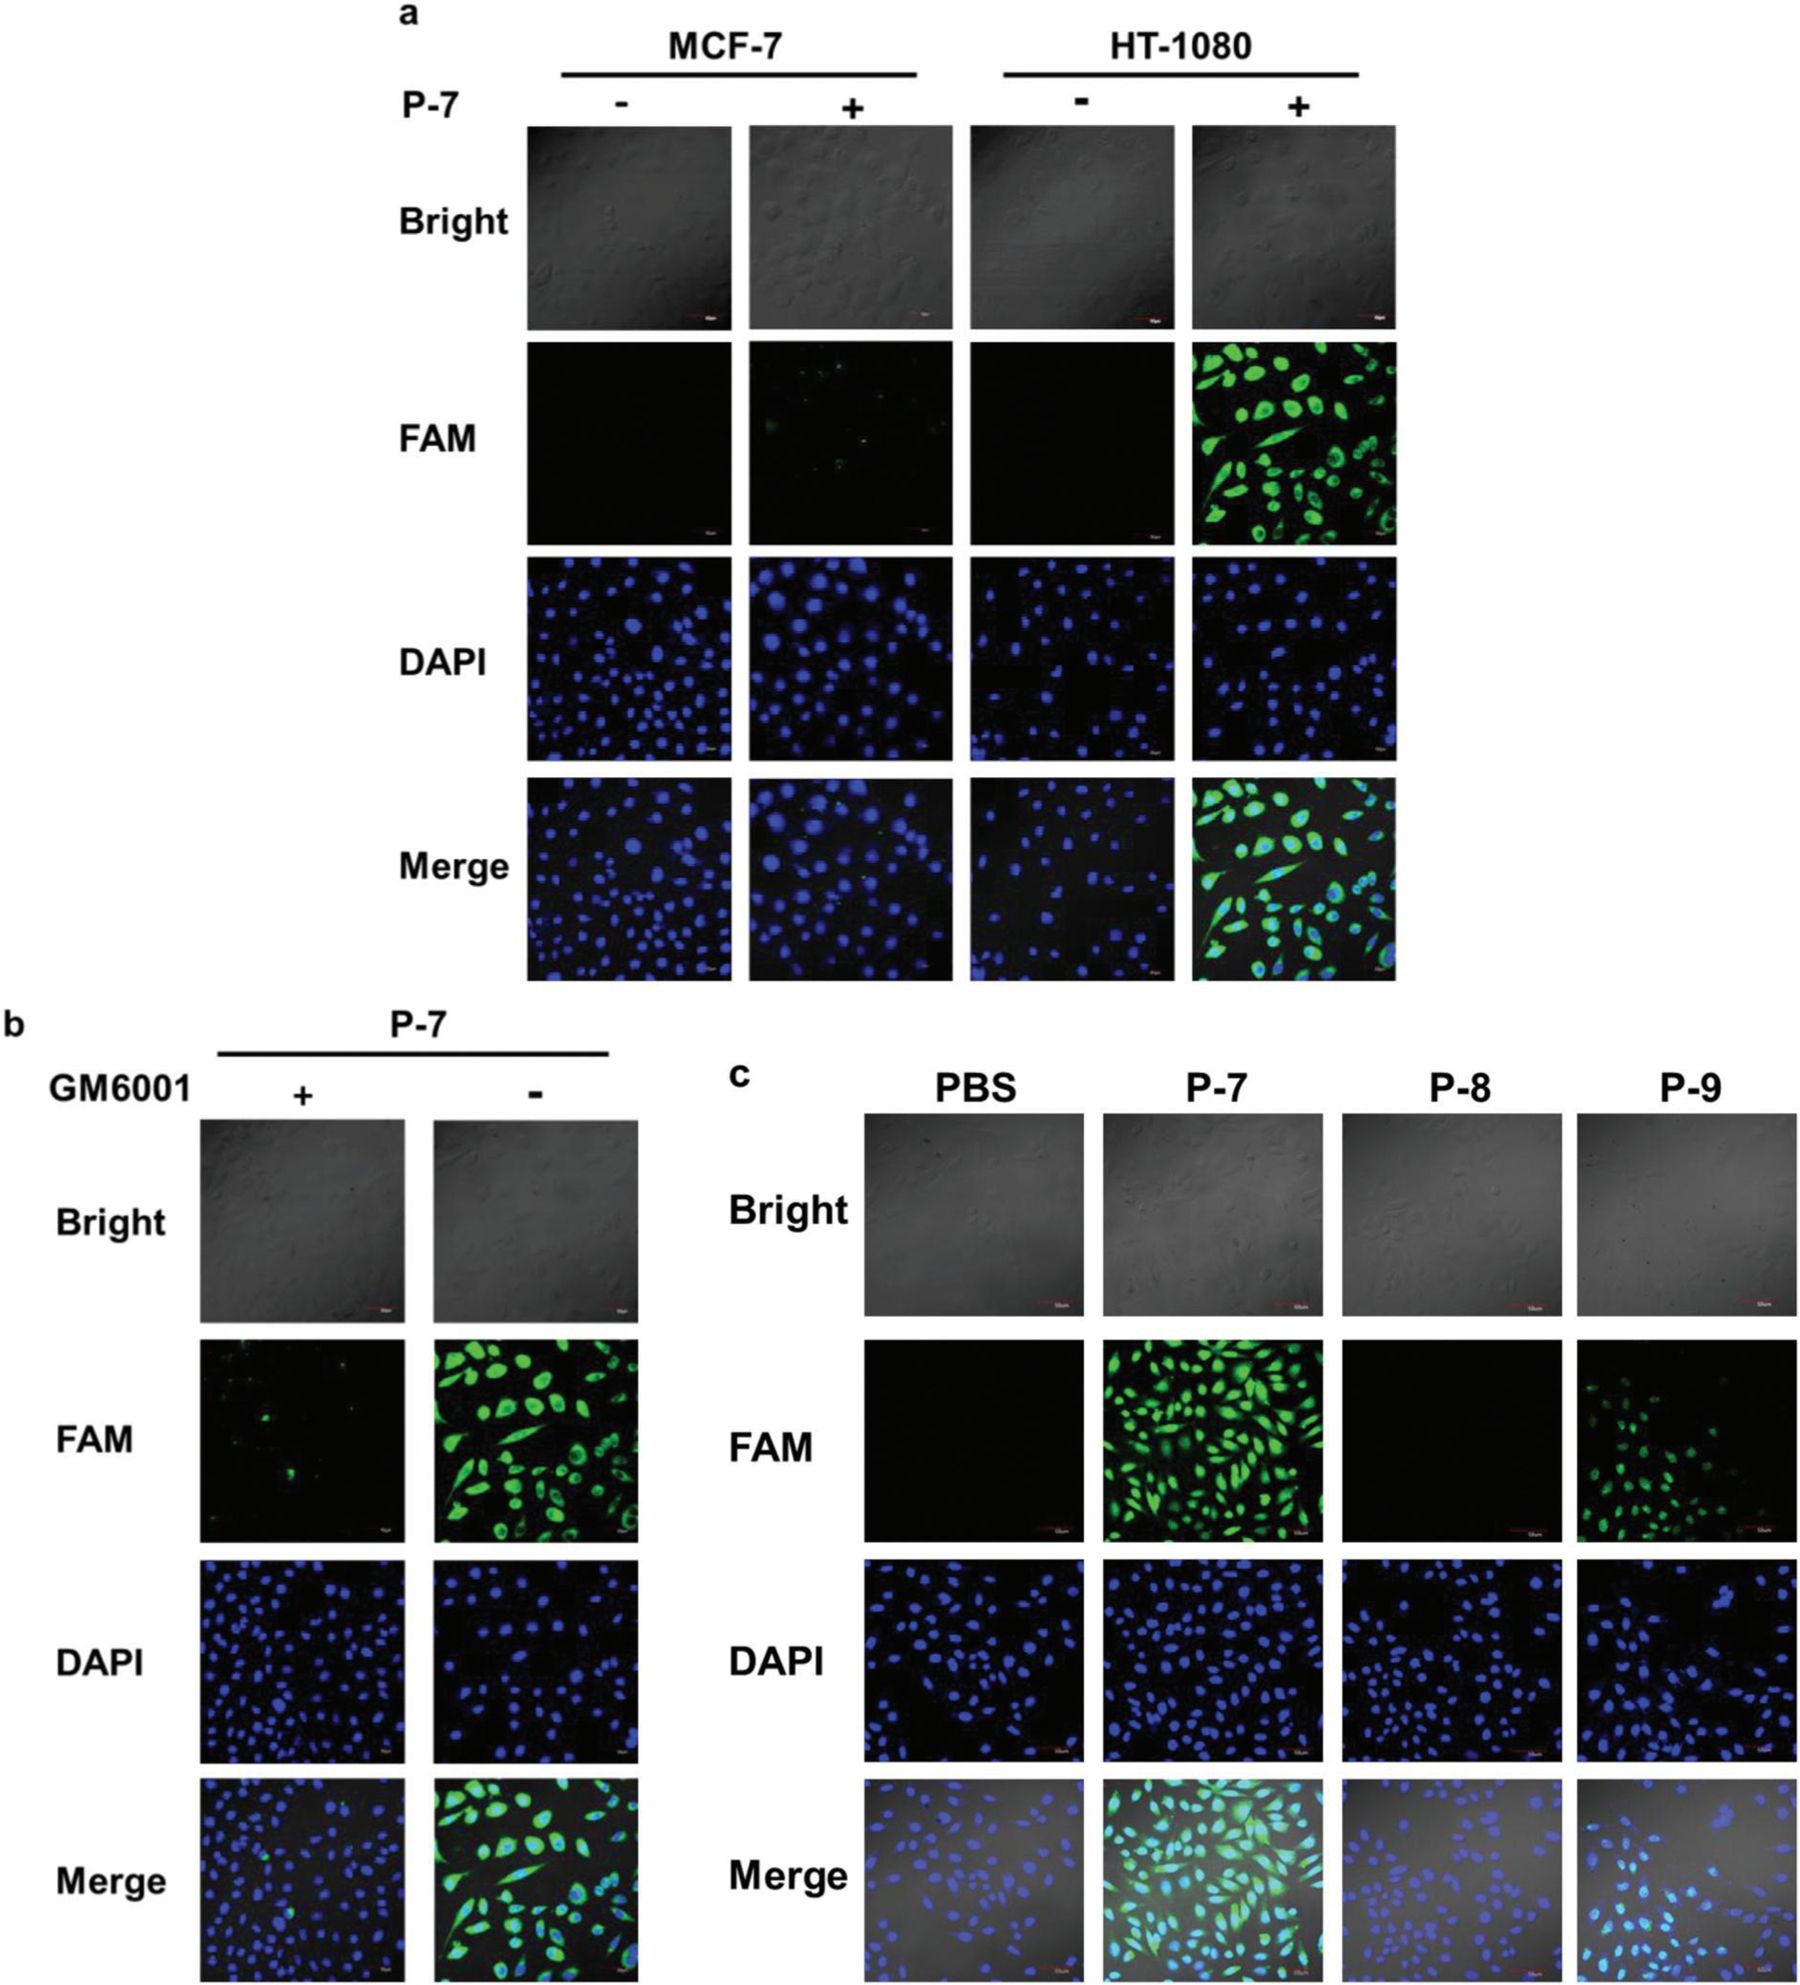
Fig. 4.

Cell uptake of the MT1-MMP fluorogenic probes, (a) Cell uptake of P-7 by HT-1080 cells and MCF-7 cells, (b) Cellular uptake of P-7 by the HT-1080 cell line in the presence or absence of the broad-spectrum MMP-inhibitor GM6001 (5 μM). (c) Cell uptake of the P-7, P-8, and P-9 probes by HT-1080 cells. The concentration of these probes used in the experiment was 5 μM. The slides were stained for cell nuclei with DAPI (blue), and the fluorescence of FAM is shown in green. Scale bar, 50 μm.
