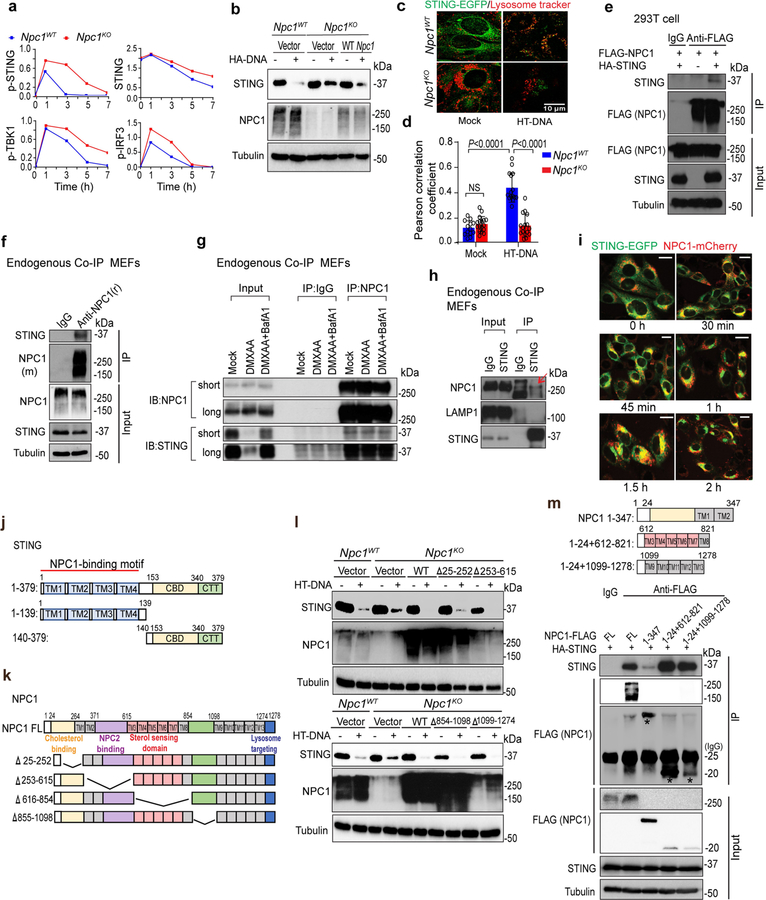
Extended Data Fig. 5 |. NPC1 interacts with STING and mediates the lysosomal degradation of STING.
a, Quantification of immunoblots in Fig. 3a. b, Immunoblot analysis of STING degradation in Npc1WT, Npc1KO or Npc1KO MEFs stably expressing wild-type NPC1. Cells were mock-treated or stimulated with HT-DNA (1 μg ml−1) for 8 h. c, d, Live-cell microscopy images of STING–EGFP and lysosomes. Npc1WT and Npc1KO MEFs stably expressing STING–EGFP were mock-treated (left) or stimulated with HT-DNA (right, 4 μg ml–1). STING–EGFP is shown in green and LysoTracker-Red is shown in red. Scale bar, 10 μm. Representative images in c and quantifications in d. Npc1WT 0 h (n = 13), Npc1KO 0 h (n = 17), Npc1WT 15 h (n = 15), and Npc1KO 15 h (n = 16) for quantification. Data are mean ± s.d. Unpaired two-tailed Student’s t-test. e, Immunoblot analysis of NPC1 and STING co-immunoprecipitation in HEK293T cells. HEK293T cells were transfected with the indicated plasmids (top), and 24 h later, anti-IgG (mouse) or anti-Flag was used for the pull-down. HA–STING co-immunoprecipitation was analysed by anti-STING immunoblot. Whole-cell lysates were blotted by anti-Flag (NPC1), anti-STING and anti-tubulin as input. f, Immunoblot analysis of endogenous STING and NPC1 co-immunoprecipitation in wild-type MEFs. Anti-IgG (rabbit) or anti-NPC1 (rabbit) was used for the pull-down. Both immunoprecipitation and lysate were blotted for endogenous STING (rabbit), NPC1 (mouse) and tubulin. g, Immunoblot analysis of endogenous STING and NPC1 co-immunoprecipitation in wild-type MEFs with mock-treated, DMXAA (30 μg ml−1, 8 h)-treated or DMXAA combined with BafA1-treated (to prevent STING degradation). Anti-IgG (rabbit) or Anti-NPC1 (rabbit) was used for the pull-down. Both immunoprecipitation and lysate input were blotted for endogenous STING (rabbit) and NPC1 (mouse). h, Immunoblot analysis of endogenous STING interaction with NPC1 or LAMP1 in wild-type MEFs. Anti-IgG (rabbit) or anti-STING (rabbit) was used for the pull-down. Both immunoprecipitation and lysate input were blotted for endogenous STING, NPC1 or LAMP1. Red arrow, co-immunoprecipitated NPC1 band. i, Live-cell fluorescent microscopy analysis of STING–EGFP and NPC1–mCherry localization. Npc1KOSting1KO MEFs stably expressing STING–EGFP (green) and NPC1–mCherry (red) were stimulated with HT-DNA (4 μg ml−1) and imaged at the indicated times. Scale bars, 10 μm. j, k, Diagrams showing STING (j) and NPC1 (k) full length and truncations. l, Immunoblot analysis of STING degradation in Npc1WT, Npc1KO or Npc1KO MEFs stably expressing indicated NPC1 truncations. Cells were mock-treated or stimulated with HT-DNA (1 μg ml−1) for 8 h. Cell lysates were analysed for the proteins indicated on the left. m, Immunoblot analysis of STING interaction with NPC1 transmembrane bundles in HEK293T cells. HEK293T cells were transfected with the indicated plasmids (top), and 24 h later, anti-IgG (mouse) or anti-Flag (mouse) was used for the pull-down. Both immunoprecipitation and whole-cell lysates were analysed by anti-Flag (NPC1), anti-STING and anti-tubulin. Data are representative of at least two independent experiments.

