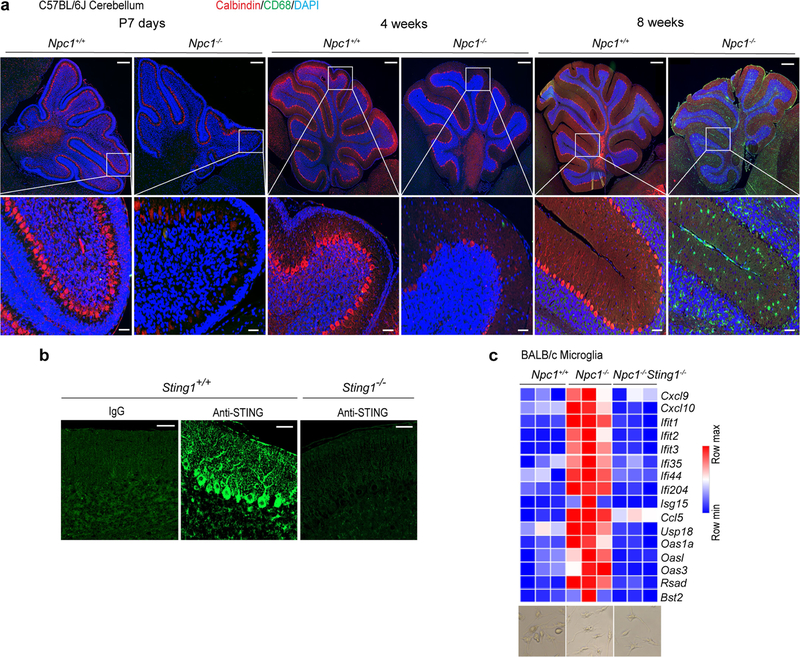
Extended Data Fig. 8 |. STING function in Purkinje cells and microglia.
a, Progression of Npc1−/− neuropathology. Fluorescent IHC staining of mouse cerebellum of Npc1+/+ and Npc1−/− mice at P7, four weeks old and eight weeks old. Calbindin is shown in red, CD68 is shown in green and DAPI is shown in blue. Representative images are shown (n = 3). Bottom panels are enlarged views. Scale bars, 200 μm (top); 30 μm (bottom). b, STING antibody validation for IHC. Fluorescent IHC staining with IgG (rabbit), anti-STING (rabbit) in wild-type C57BL/6J cerebellum or staining with anti-STING (rabbit) in Sting1−/− C57BL/6J cerebellum. Scale bars, 30 μm. Representative images are shown (n = 3). c, Heat map showing the baseline expression of ISGs in ex-vivo-cultured microglia isolated from P10–P12 mouse brains of the indicated genotypes (n = 3). The mRNA expression of each ISG was measured by qRT–PCR. Representative microscopy images of isolated microglia from indicated genotype of mice are shown at the bottom. Scale bars, 30 μm.

