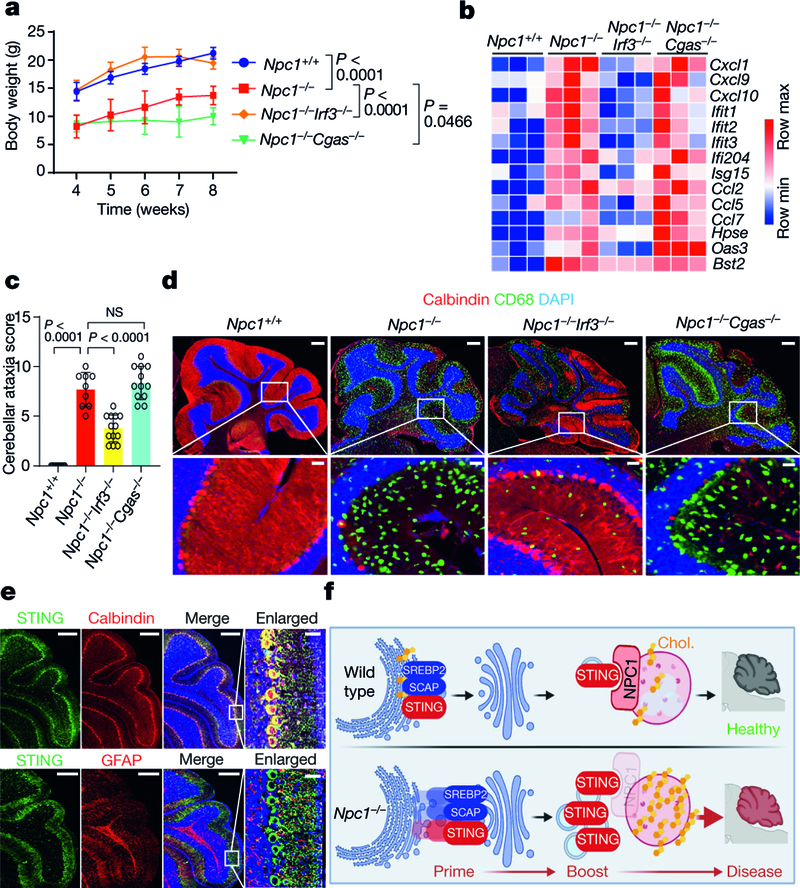
Fig. 5. IRF3, but not cGAS, is required for disease pathogenesis in Npc1−/−mice.
a, Body weight of mice of the indicated genotypes. All mice are on the C57BL/6J background (Npc1+/+ mice, n = 5; Npc1−/− mice, n = 10; Npc1−/−Irf3−/− mice, n = 10; Npc1−/−Cgas−/− mice, n = 10). b, Heat map showing ISG expression in the cerebellum of mice of the indicated genotypes (n = 3; 8 weeks old). The mRNA expression of each ISG was measured by qRT–PCR. c, Cerebellar ataxia scores of mice of the indicated genotypes (8 weeks old). All mice are on the C57BL/6J background. Mice were scored as in Fig. 4b (Npc1+/+ mice, n = 9; Npc1−/− mice, n = 9; Npc1−/−Irf3−/− mice, n = 13; Npc1−/−Cgas−/− mice, n = 12). d, Fluorescent IHC staining of the cerebellum of mice (C57BL/6J) of the indicated genotypes. Calbindin is shown in red, CD68 is shown in green and DAPI is shown in blue. Representative images are shown (n = 3). The bottom images are enlarged views. Scale bars, 200 μm (top); 30 μm (bottom). e, Fluorescent IHC co-staining of neural markers with STING in the cerebellum of wild-type mice (C57BL/6J; 4 weeks old). Top, STING is shown in green and calbindin (Purkinje cell marker) is shown in red. Bottom, STING is shown in green and GFAP (astrocyte marker) is shown in red. DAPI is shown in blue. Representative images are shown (n = 3). Scale bars, 200 μm (main panels); 30 μm (enlarged views; far right). f, Graphical abstract of the study. Chol., cholesterol. a, c, Data are mean ± s.d. a, Two-way ANOVA. c, Unpaired two-tailed Student’s t-test.

