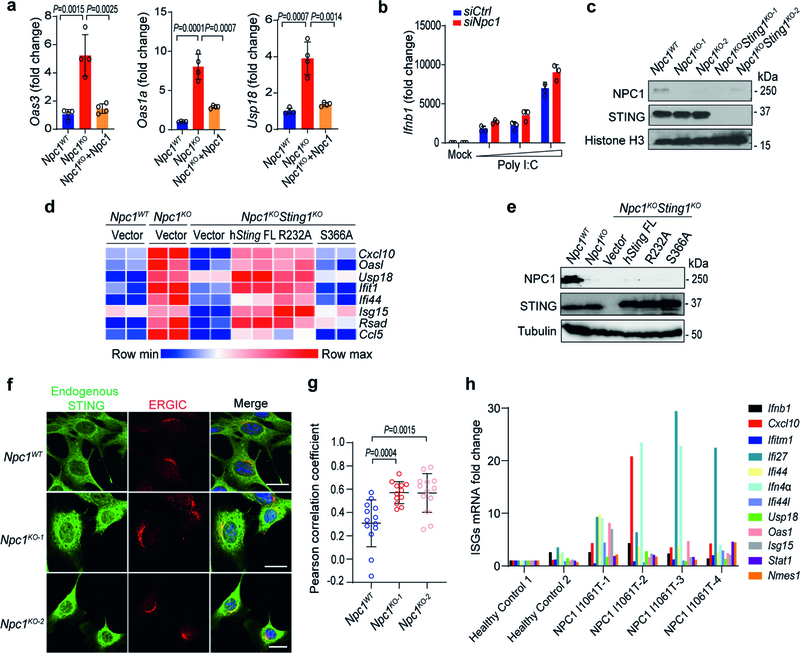
Extended Data Fig. 2 |. NPC1 deficiency primes STING trafficking and activation independently of cGAMP.
a, qRT–PCR analysis of the baseline expression of ISGs (Oas3, Oas1a and Usp18) in Npc1WT, Npc1KO and Npc1KO MEFs stably expressing wild-type Npc1 (n = 4). b, qRT–PCR analysis of Ifnb1 mRNA expression in wild-type and Npc1-knockdown MEFs after stimulation with an increasing amount of Poly I:C (0, 1, 2, 4 μg ml−1) for 3 h (n = 3). c, Immunoblot analysis of the indicated proteins (left) in Npc1WT, Npc1KO and Npc1KOSting1KO MEFs. d, Heat map showing the baseline expression of ISGs in Npc1WT, Npc1KO and Npc1KOSting1KO MEFs reconstituted with vector, STING wild type (FL), R232A or S366A mutants (n = 2). The mRNA expression of each ISG was measured by qRT–PCR. e, Immunoblot analysis of the indicated proteins (left) in different reconstituted MEFs (shown on top) as in d. f, Fluorescent microscopy analysis of endogenous STING localization at the resting state in Npc1WT and two independent clones of Npc1KO MEFs. Endogenous STING is shown in green, an ERGIC marker (ERGIC53) is shown in red and DAPI is shown in blue. Scale bars, 10 μm. g, Quantification of STING co-localization with the ERGIC in f (Npc1WT, n = 13; Npc1KO-1, n = 12; Npc1KO-2, n = 13). h, qRT–PCR analysis of the baseline expression of ISGs in fibroblasts from healthy control individuals (n = 2) and unrelated patients with Niemann–Pick disease type C (NPC1I1061T) (n = 4). a, b, g, Data are mean ± s.d. a, g, Unpaired two-tailed Student’s t-test. Data are representative of at least two independent experiments.

