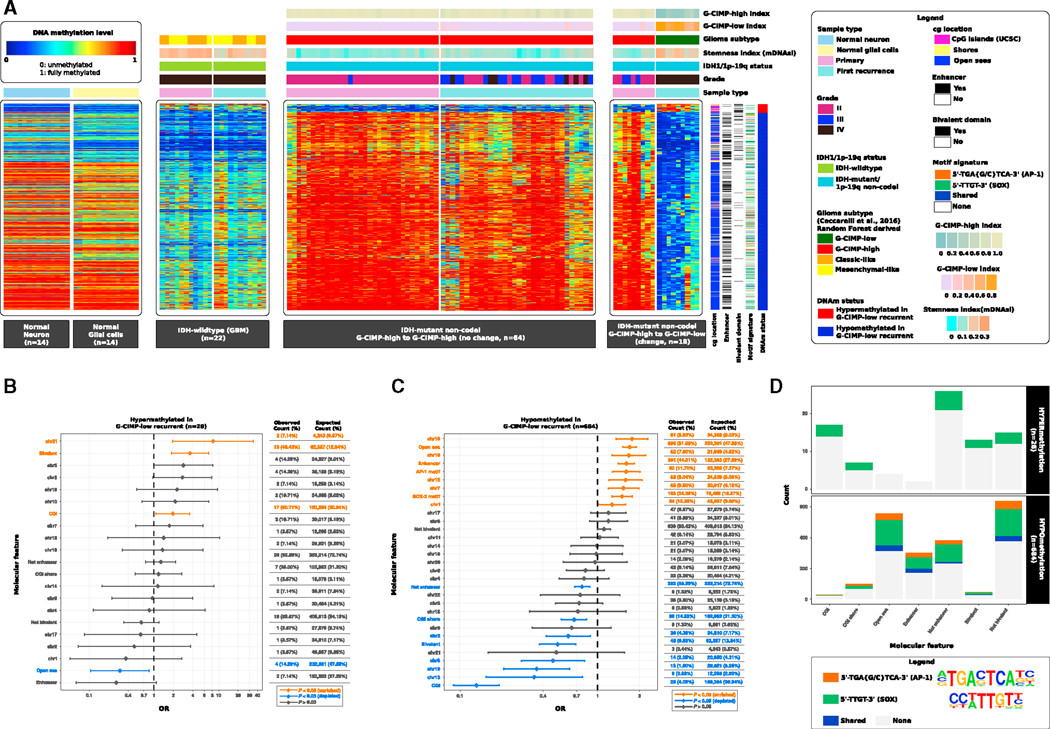
Figure 4. G-CIMP-High to G-CIMP-Low Malignant Transformation Is Defined by Epigenomic Changes at Genomic Biofeatures Associated with Glioma Progression and Normal Development.
(A) Heatmaps of DNA methylation data. Columns represent non-tumor brain cells (normal neuron cells and normal glial cells, n = 28), IDH-wild-type GBMs (n = 22), and IDH mutant non-Codel gliomas (n = 82) grouped according to their epigenomic profiles at primary and first recurrent surgery time points. Normal and tumor samples are sorted by hierarchical clustering. Rows represent CpG probes identified after supervised analysis between DNA methylation of G-CIMP-high tumors at primary diagnosis and their G-CIMP-low counterparts at first recurrence sorted by hierarchical clustering (n = 28 hypermethylated probes and n = 684 hypomethylated probes in G-CIMP-low first recurrent tumors; FDR < 0.05, difference in mean methylation beta value < —0.4 and > 0.5). Labels at the top and tracks on the right of the heatmaps represent clinical and molecular features of interest. The saturation of either color (scale from blue to red) reflects the magnitude of the difference in DNA methylation level.
(B and C) OR for the frequencies of differentially hypermethylated probes (B) and differentially hypomethylated probes (C), respectively, that overlap a particular molecular feature relative to the expected genome-wide distribution of 450,000 probes.
(D) De novo and known motif scan analyses identified recurring patterns in DNA that are presumed to have sequence binding-specific sites for the c-JUN/AP-1 (5ʹ-TGA{G/C}TCA-3ʹ) and SOX family of transcription factors (5ʹ-TTGT-3ʹ). The molecular features overlapping both motif signatures are shown.
See also Figures S2 and S3.

