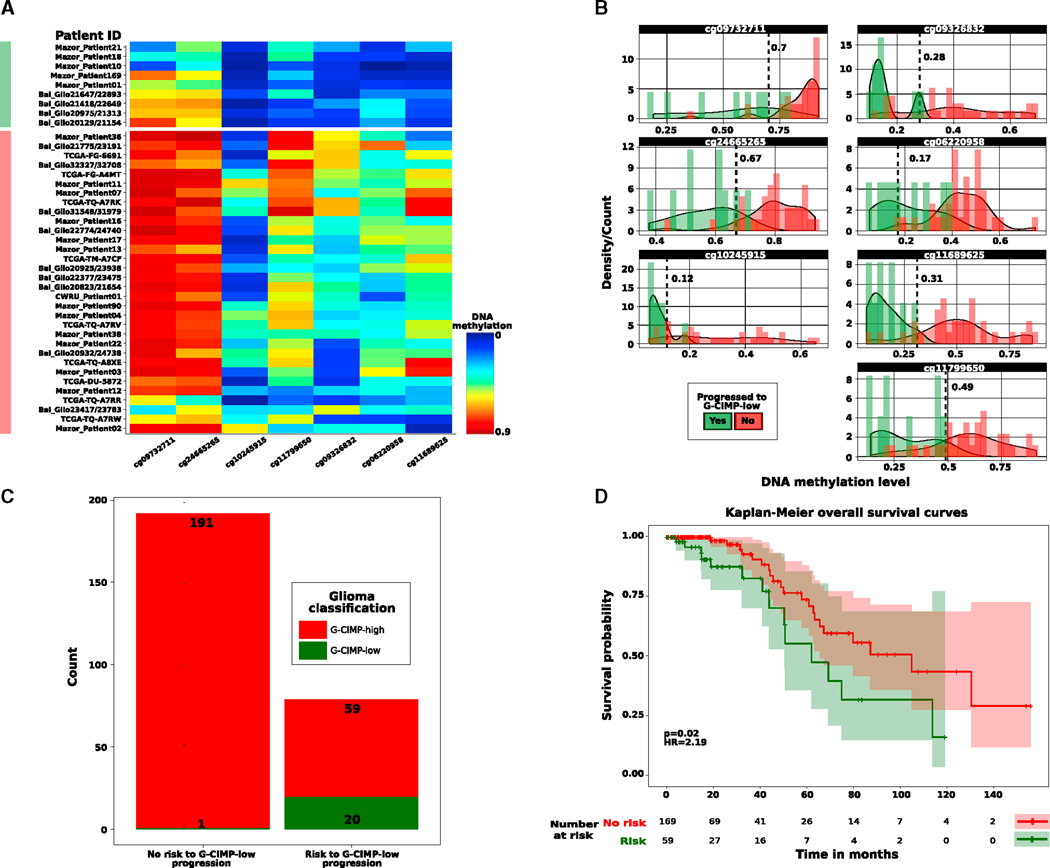
Figure 5. Clinical Application of Malignant Progression to G-CIMP-Low.
(A) Heatmap of DNA methylation data. Rows represent initially LGG G-CIMP-high tumors that progress to grade IV G-CIMP-low at first recurrence (labeled in green) and initially LGG G-CIMP-high tumors that retain their original G-CIMP-high phenotype at first recurrence with normal-like or indolent diseases (labeled in red). Glioma samples are sorted by hierarchical clustering. Columns represent the candidate predictive clinical biomarkers identified after supervised analysis of DNA methylation between the two tumor groups mentioned above sorted by hierarchical clustering (n = 7; unadjusted p < 0.05, absolute difference in mean methylation beta value > 0.2). The saturation of either color (scale from blue to red) reflects the magnitude of the difference in DNA methylation level.
(B) Beta value thresholds that more specifically distinguish the primary glioma cases that progress to the aggressive G-CIMP-low phenotype from those primary glioma cases that relapse without malignant transformation and progression to the G-CIMP-low phenotype are represented and used to dichotomize the DNA methylation data in an independent validation cohort (n = 271).
(C and D) Predictive clinical biomarkers of G-CIMP-low progression correlate with epigenomic subtype (C) and patient outcomes (D).

