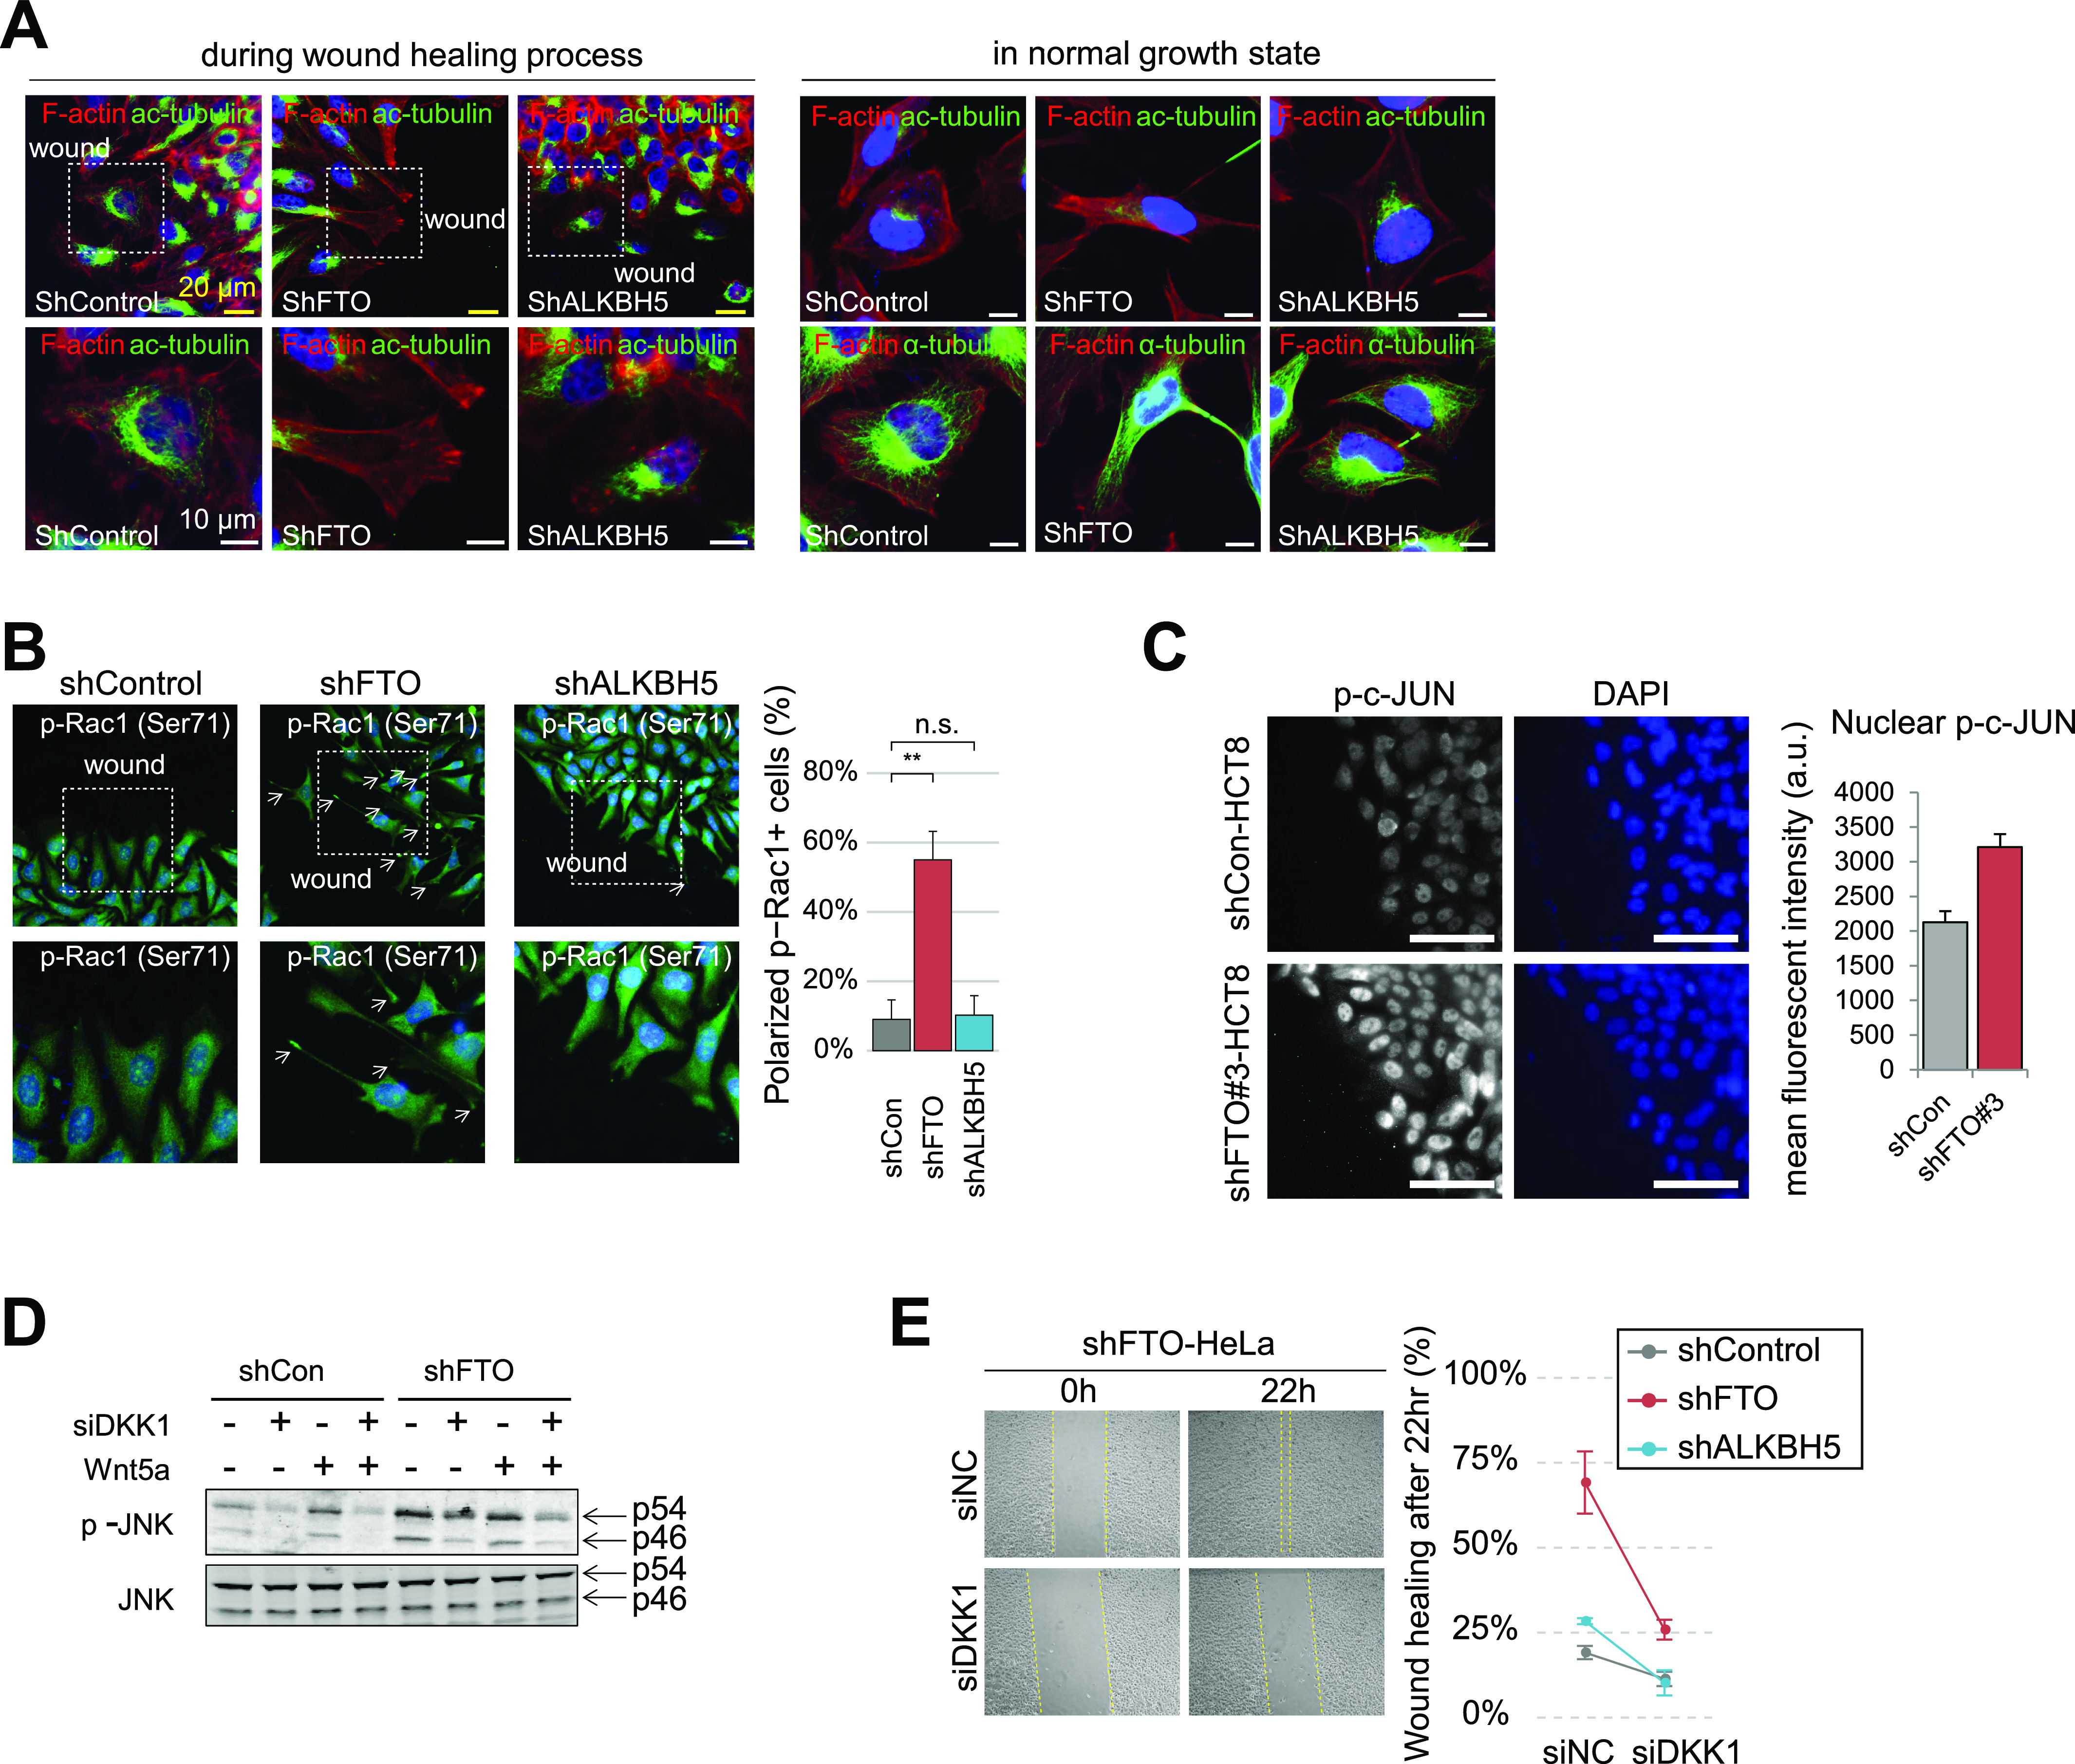
Figure 4. Loss of FTO enhances cell migration by activating WNT/PCP signaling.

(A) Filamentous actin (F-actin) and acetylated Tubulin (ac-tubulin) were visualized in cells during wound healing (6 h after scratch, see the Materials and Methods section) or in normal growth state. Regions enclosed by the dashed rectangles were enlarged and shown below. Directions of wound scratch were indicated. Scale bars are either 20 μm (yellow bars) or 10 μm (white bars). (B) Activated Rac1 was visualized using anti-p-Rac1 (Ser71) antibody in cells after 6 h of scratch wounding. Cells with polarized p-Rac1 staining near the wound edge were counted and graphed (right) (shCon, n = 3; shFTO, n = 4; shALKBH5, n = 3). Regions enclosed by the dashed rectangles were enlarged and shown below. Directions of wound scratch were indicated. (C) Phosphorylated c-JUN was visualized in HCT-8 cells after 6 h of scratch wounding near the wound edge (n = 5). Mean fluorescent intensities of nuclear p-c-JUN were measured with ImageJ software and graphed (right). Scale bars are 100 μm. (D) Levels p54 and p46 JNK and its activated form (p-JNK) were assessed by Western blot. Control or FTO-depleted HeLa cells were transiently transfected with either control siRNA (−) or DKK1 siRNA (+). Cells were treated with recombinant WNT5a protein for 12 h. (E) FTO-depleted HeLa cells along with control of ALKBH5-depleted cells were further transfected with either control (siNC) or DKK1 siRNA (siDKK1). Scratch wound-healing assays were performed 48 h after siRNA transfection. Representative wound healing of FTO-depleted cells were shown on the left. Yellow dashed lines indicate wound edges. Percentage of wound healing after 22 h were calculated as “100 − (wound width at 0 h − wound width at 22 h/wound width at 0 h)” (n = 3). Error bars are ± SEM. One-sided t test, **P < 0.01, n.s. P > 0.05.
