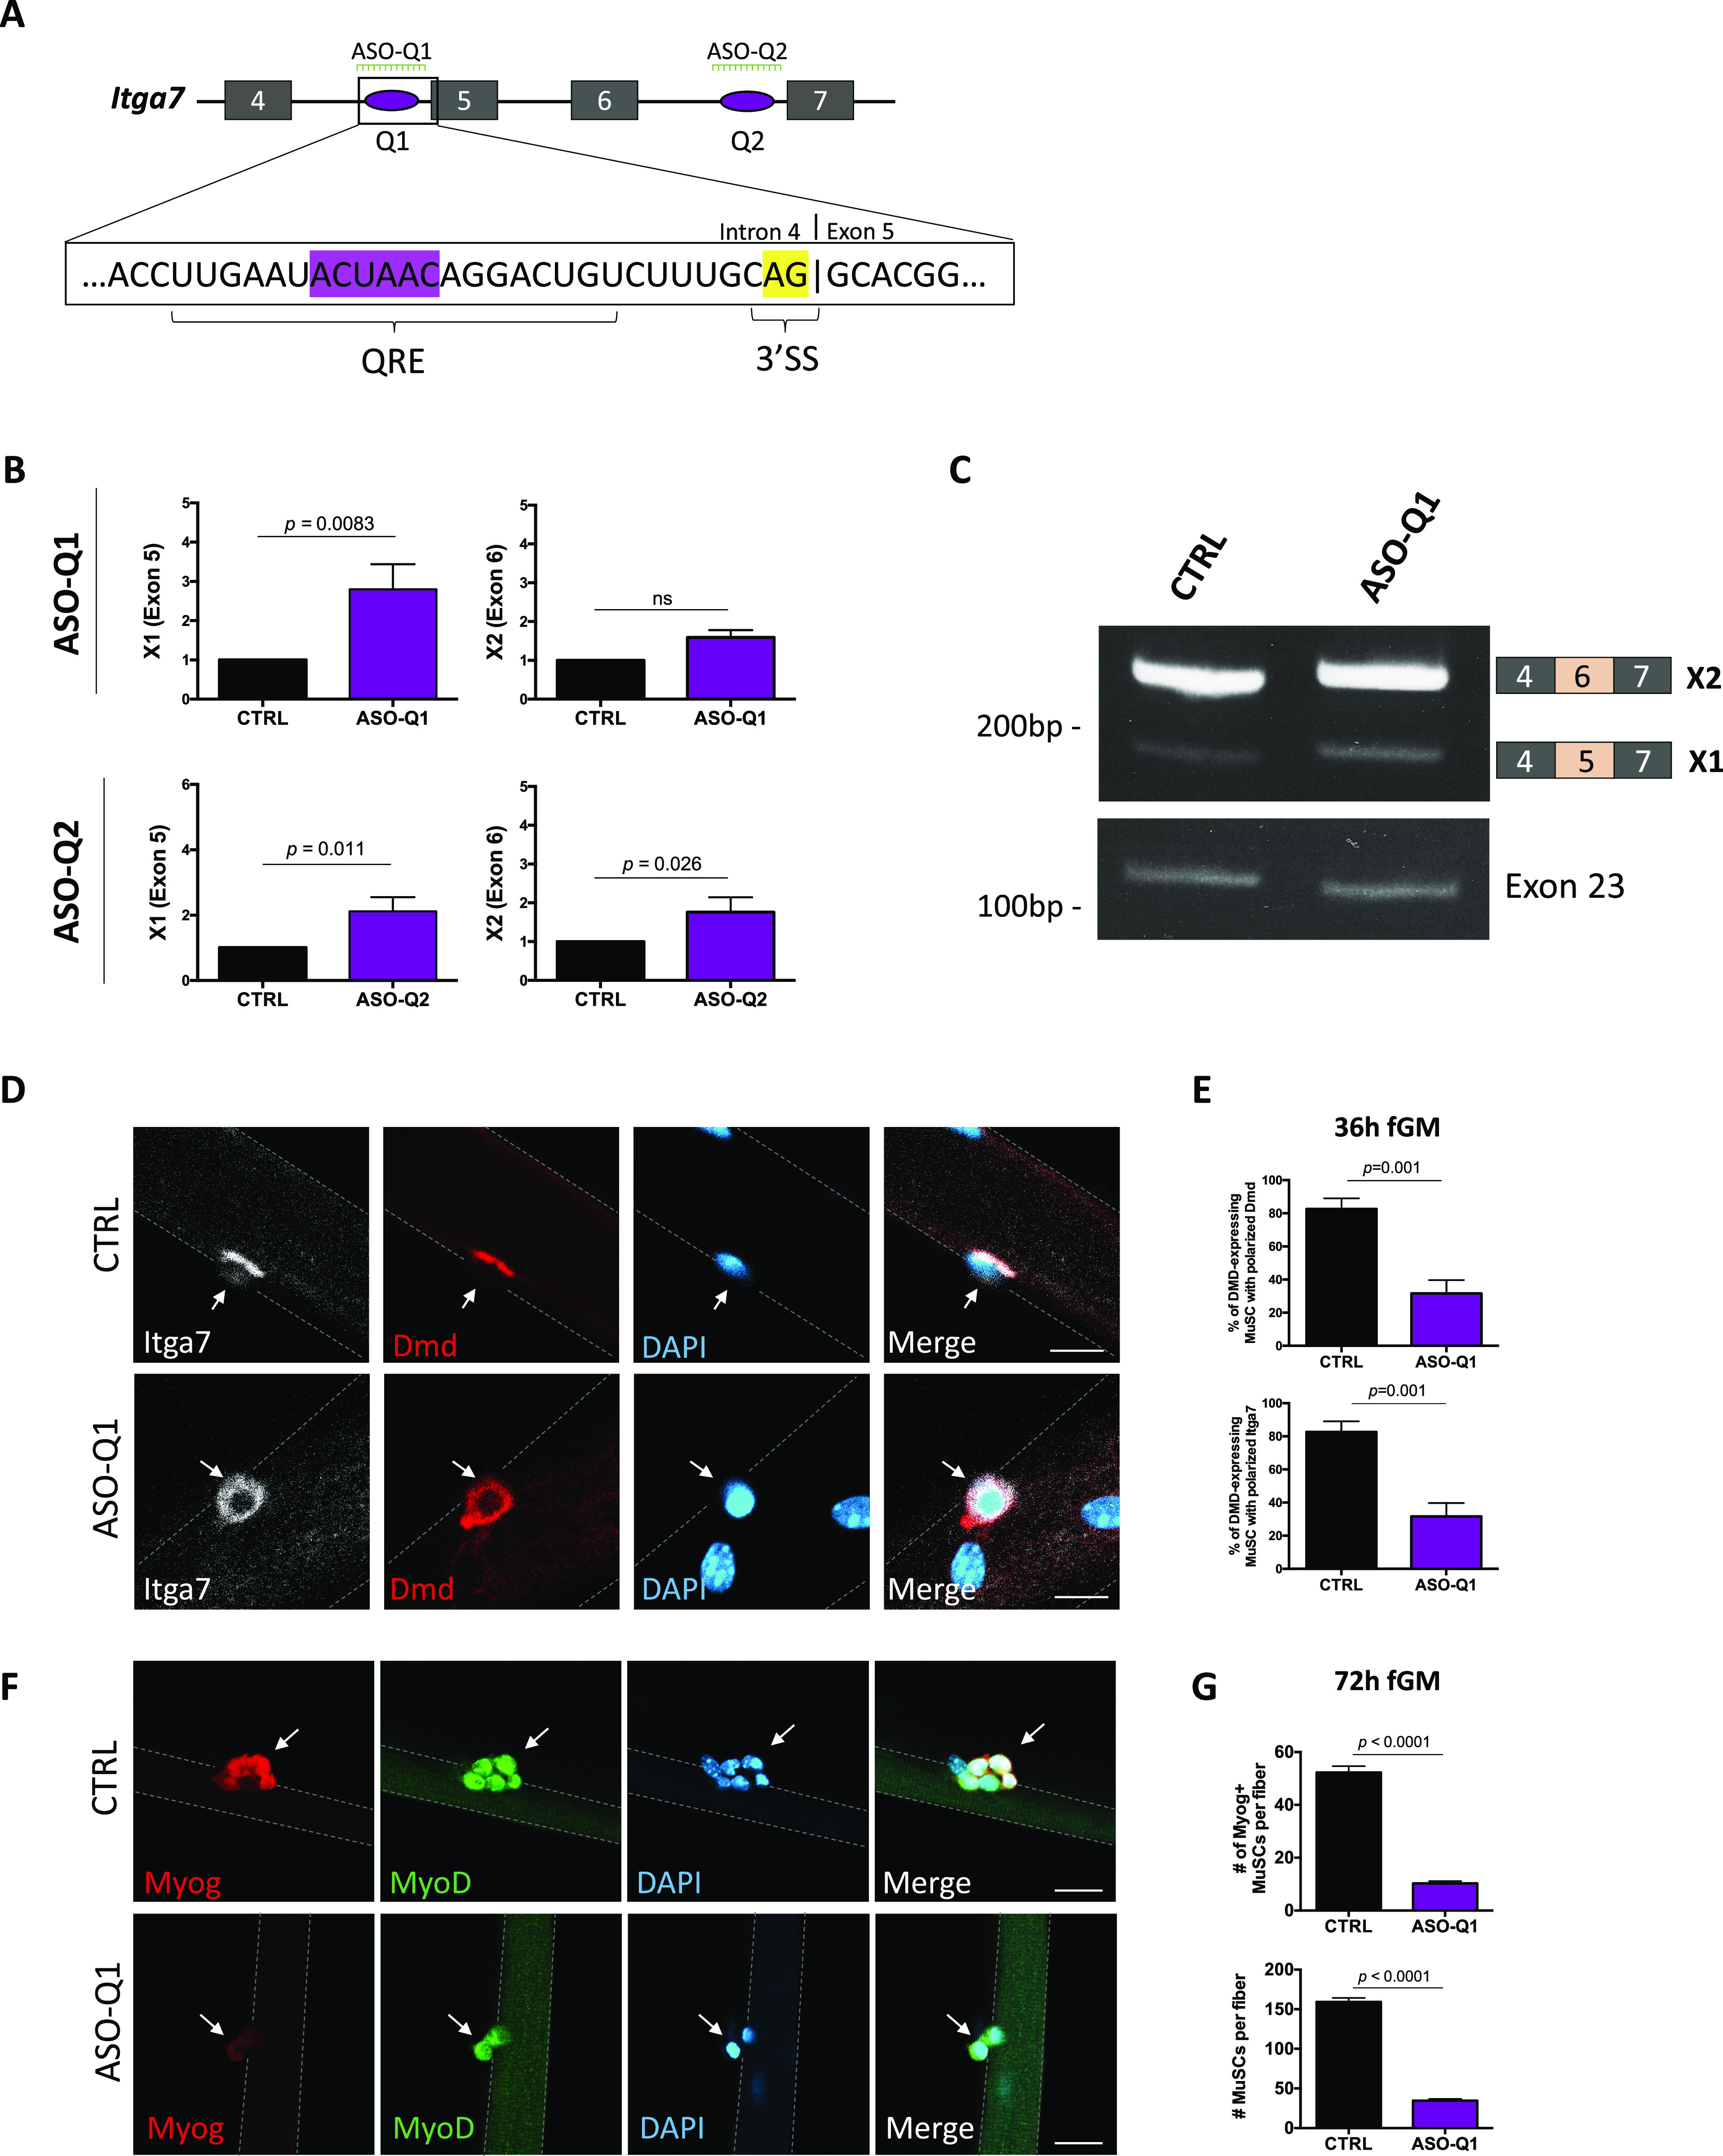
Figure 4. Inclusion of Itga7-X1 (exon 5) is sufficient to induce loss of muscle stem cell (MuSC) polarity and reduction of myogenic progenitors.

(A) Schematic of Itga7 transcript from exon 4 to exon 7 is shown. QKI response elements represented as purple ovals; Q1 being most upstream and Q2 being downstream. The magnified box shows Q1 sequence with the core QKI response element site (ACUAAC) highlighted in purple, whereas the 3′ splice site (3′-SS) is highlighted in yellow. Location of antisense oligonucleotide (ASO) sequences against Q1 and Q1 (ASO-Q1 and ASO-Q2, respectively) are shown in green. (B) RT-qPCR for Itga7 XI (exon 5) and Itga7 X2 (exon 6), normalized to Gapdh in C57BL/6 wild type primary MuSCs treated with ASO against Q1 (ASO-Q1) and Q2 (ASO-Q2) (n = 3 replicates, ns, not significant, unpaired t test). (C) Semi-quantitative RT–PCR for Itga7 XI (exon 5), Itga7 X2 (exon 6), and Itga7 exon 23 unchanged region control in C57BL/6 wild type primary MuSCs treated with ASO against Q1 (ASO-Q1). PCR products were separated on acrylamide gels and stained with ethidium bromide. The migration of DNA markers in base pairs (bp) is shown on the left, and exon inclusion/exclusion diagram is shown on the right. (D) Myofibers isolated from C57BL/6 wild type mice and transfected with ASO-Q1 4 and 16 h after adding culture media. Fibers were fixed 32 h after transfection and immunostained for Itga7 (white) or Dmd (Red), and counterstained with DAPI (blue). Scale bar represents 10 μm. (E) Quantification of Dmd-expressing cells with polarized Dmd (upper panel) and Itga7 (lower panel) (error bars represent mean ± SEM, n = 3 biological replicates, minimum 200 cells counted per group, P = 0.001, unpaired t test). (F) Myofibers isolated C57BL/6 wild type mice and transfected with ASO-Q1 or CTRL at 4 and 16 h after adding culture media. Fibers were fixed 72 h after addition of culture media, and immunostained for MyoD (green) and Myogenin (red) and counterstained with DAPI (blue). Scale bar represents 20 μm. White arrows point to MuSCs. (G) Quantification of Myogenin-positive MuSCs per myofiber (upper panel) and total number of MuSCs per myofiber (lower panel). Error bars represent mean ± SEM, n = 3 biological replicates, minimum 400 cells counted per group, P < 0.0001, unpaired t test.
