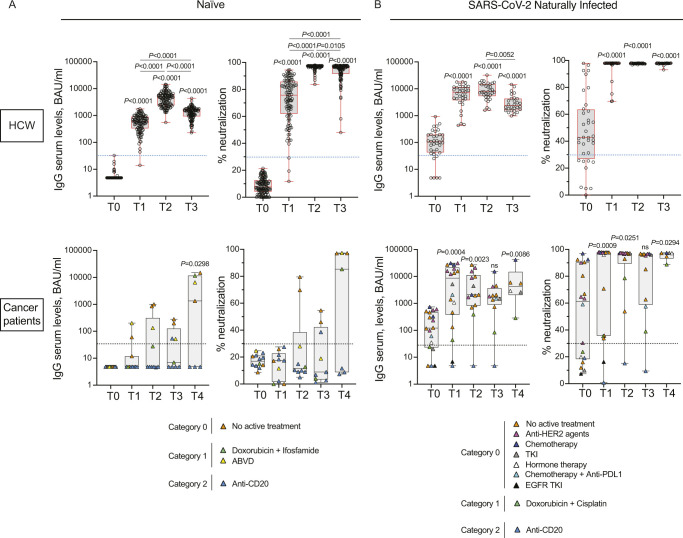
Figure S1. SARS-CoV-2–naïve cancer patients treated with anti-CD20 fail to produce neutralizing antibodies.
(A, B) IgG antibody response and its neutralizing activity were measured in serum of vaccinated naïve (HCW, n = 125; cancer patients, n = 12) (A) and SARS-CoV-2 naturally infected (HCW, n = 36; cancer patients, n = 18) (B) health-care workers (HCW), and cancer patients at different time points (T0, T1, T2, and T3). Cancer patients received also the booster dose and sera were analyzed at 2 wk after the third dose (T4, naïve, n = 7; SARS-CoV-2 naturally infected, n = 6). Samples ≥33.8 BAU/ml (IgG plasma levels) or ≥ 30% signal inhibition (neutralization) were considered positive (dotted blue and black lines). For IgG serum levels, log scale on the y-axis. The box plots show the interquartile range, the horizontal lines show the median values, and the whiskers indicate the minimum-to-maximum range. Each dot corresponds to an individual subject. P-values were determined using two-tailed Kruskal–Wallis test with Dunn’s multiple comparisons post test. P-values refer to baseline (T0) when there are no connecting lines. Cancer patients were classified according to the type of treatment: no active treatment or low (category 0, orange), medium (category 1, green) or high (category 2, blue) interference with the immune system. The distribution of patients in each category and the type of treatment are indicated in the legend.

