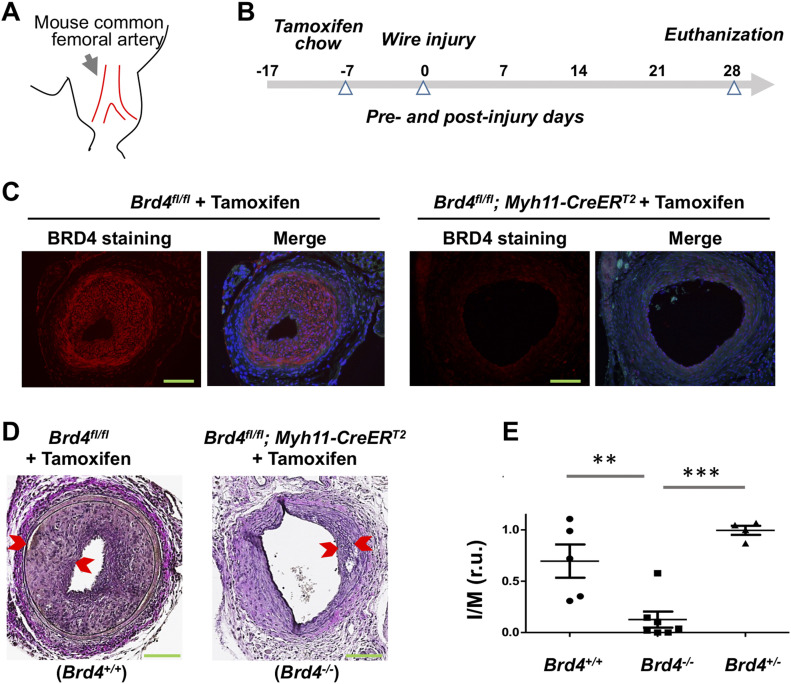
Figure 5. Smooth muscle cell-specific BRD4 KO reduces IH in wire-injured mouse femoral arteries.
(A) Cartoon of mouse common femoral artery where wire injury was made to induce IH. (B) Diagram indicating the time line for tamoxifen feeding, wire injury, and tissue collection. (C) Immunofluorescence confirming tamoxifen-induced BRD4 KO in mouse arteries. Scale bar: 50 μm. (D) Comparison of IH between WT (Brd4fl/fl) and smooth muscle cell-specific BRD4 KO (Brd4fl/fl; Myh11-CreERT2) mice. Neointima thickness is demarcated by arrow heads. IH is normalized as intima/media area (I/M) ratio. Scale bar: 50 μm. (E) Quantification: Mean ± SEM; n = 4–7 mice, as indicated by the data points in scatter plots. Statistics: one-way ANOVA with Bonferroni test; **P < 0.01, ***P < 0.001; r.u., relative unit.

