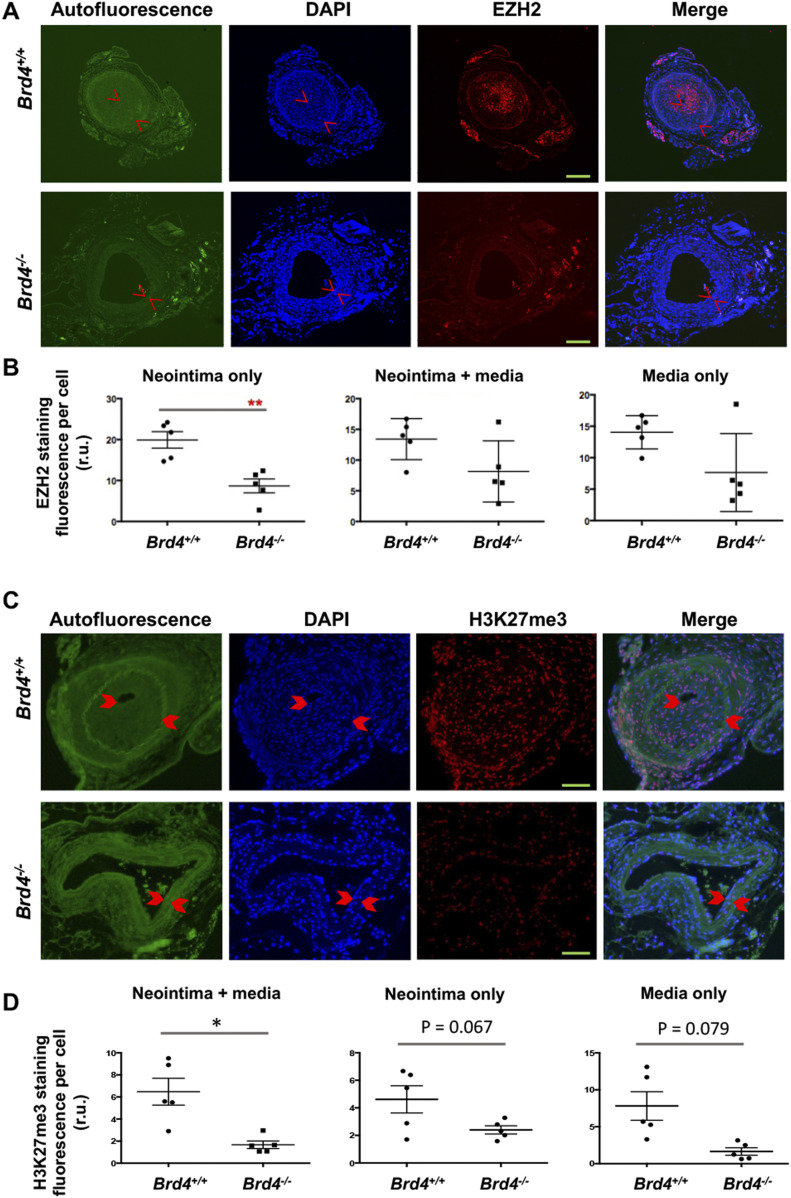
Figure 6. Reduced EZH2 and H3K27me3 in mouse arteries of smooth muscle cell-specific BRD4 KO.
Tamoxifen-induced BRD4 KO and wire injury were performed as described for Fig 5. (A, B, C, D) Immunofluorescence shows comparison of EZH2 (A, B) or its catalytic product H3K27me3 (C, D) between WT and BRD4 conditional KO mice. Neointima is demarcated by arrow heads. Fluorescence intensity was normalized to cell number (DAPI-stained nuclei). Scale bar: 50 μm. Quantification: Mean ± SEM; n = 5 mice as indicated by the data points in scatter plots. Statistics: nonparametric Mann–Whitney test following Shapiro–Wilk normality determination, *P < 0.05, **P < 0.01; r.u., relative unit.

