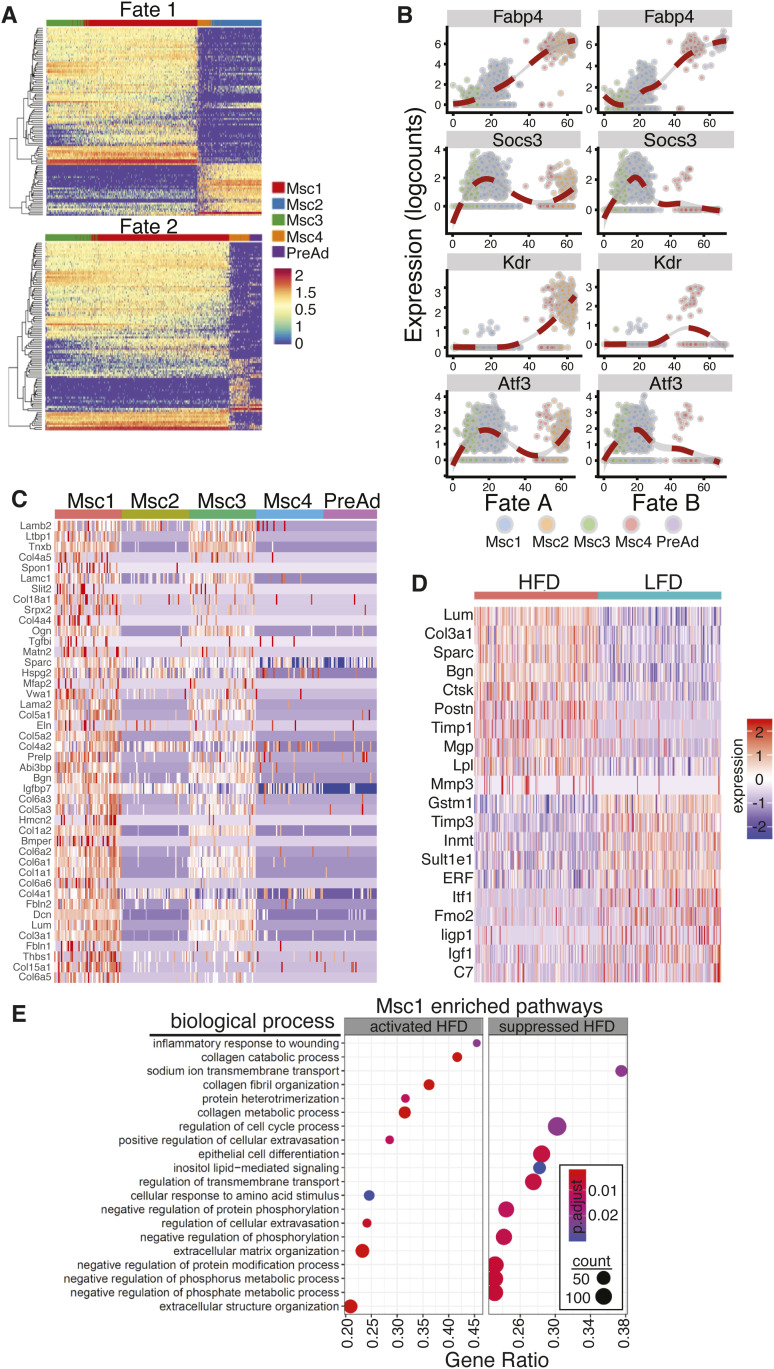
Figure 2. Progenitor cells produce ECM.
(A) Heat map of the top 250 genes that are associated with each lineage identified. (B) Expression profiles of select genes during both lineages identified; dots represent a cell and line represents the loess regression. (C) Heat map of ECM genes differentially expressed in mesenchymal stem cells and preadipocytes. (D) Heat map of ECM genes differentially expressed between low-fat diet and high-fat diet in MSC1 population. (E) Dot plot of gene ontology (biological process) of activated and suppressed pathways by high-fat diet in MSC1 cluster.

