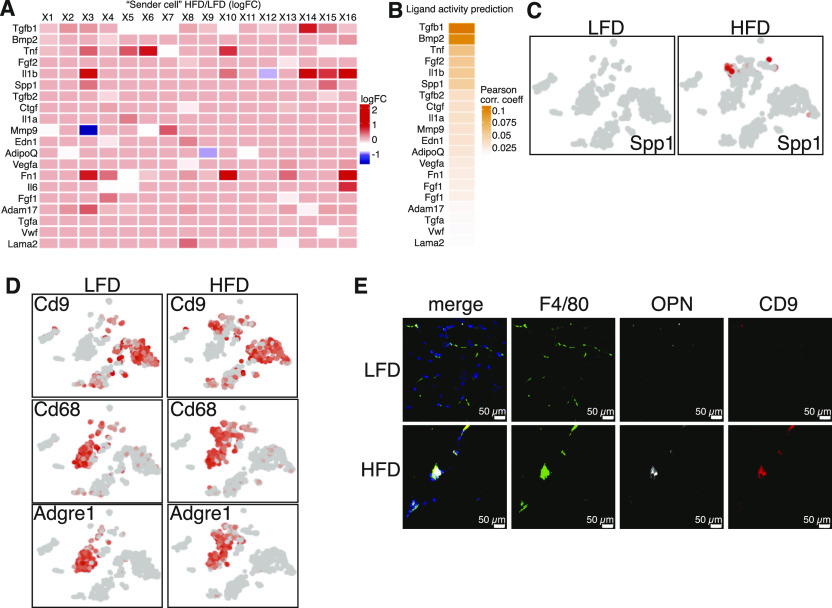
Figure 4. CD9+ macrophages communicate with platelet-derived growth factor receptor α and platelet-derived growth factor receptor β progenitor cells through the secretion of osteopontin.
(A) “Sender” cells differentially express potential pan-ligands a cross each cluster between low-fat diet (LFD) and high-fat diet (HFD) eWAT. Ligand-cell pairings indicate cell types in which the corresponding ligand is significantly differentially five expressed in HFD with adjusted P < 0.05. Average natural log fold change (ratio of HFD to LFD expression) is shown in the blue-red color scale. (B) Ligand activity prediction ranked by Pearson correlation coefficient (orange color scale). (C) t-SNE expression plots of osteopontin (Spp1). (D) t-SNE expression plots of select macrophages markers and Cd9. (E) Representative image of F4/80, OPN, and CD9 immunofluorescent co-staining in 24-wk LFD and HFD feed mice, scale bars 50 μm.

