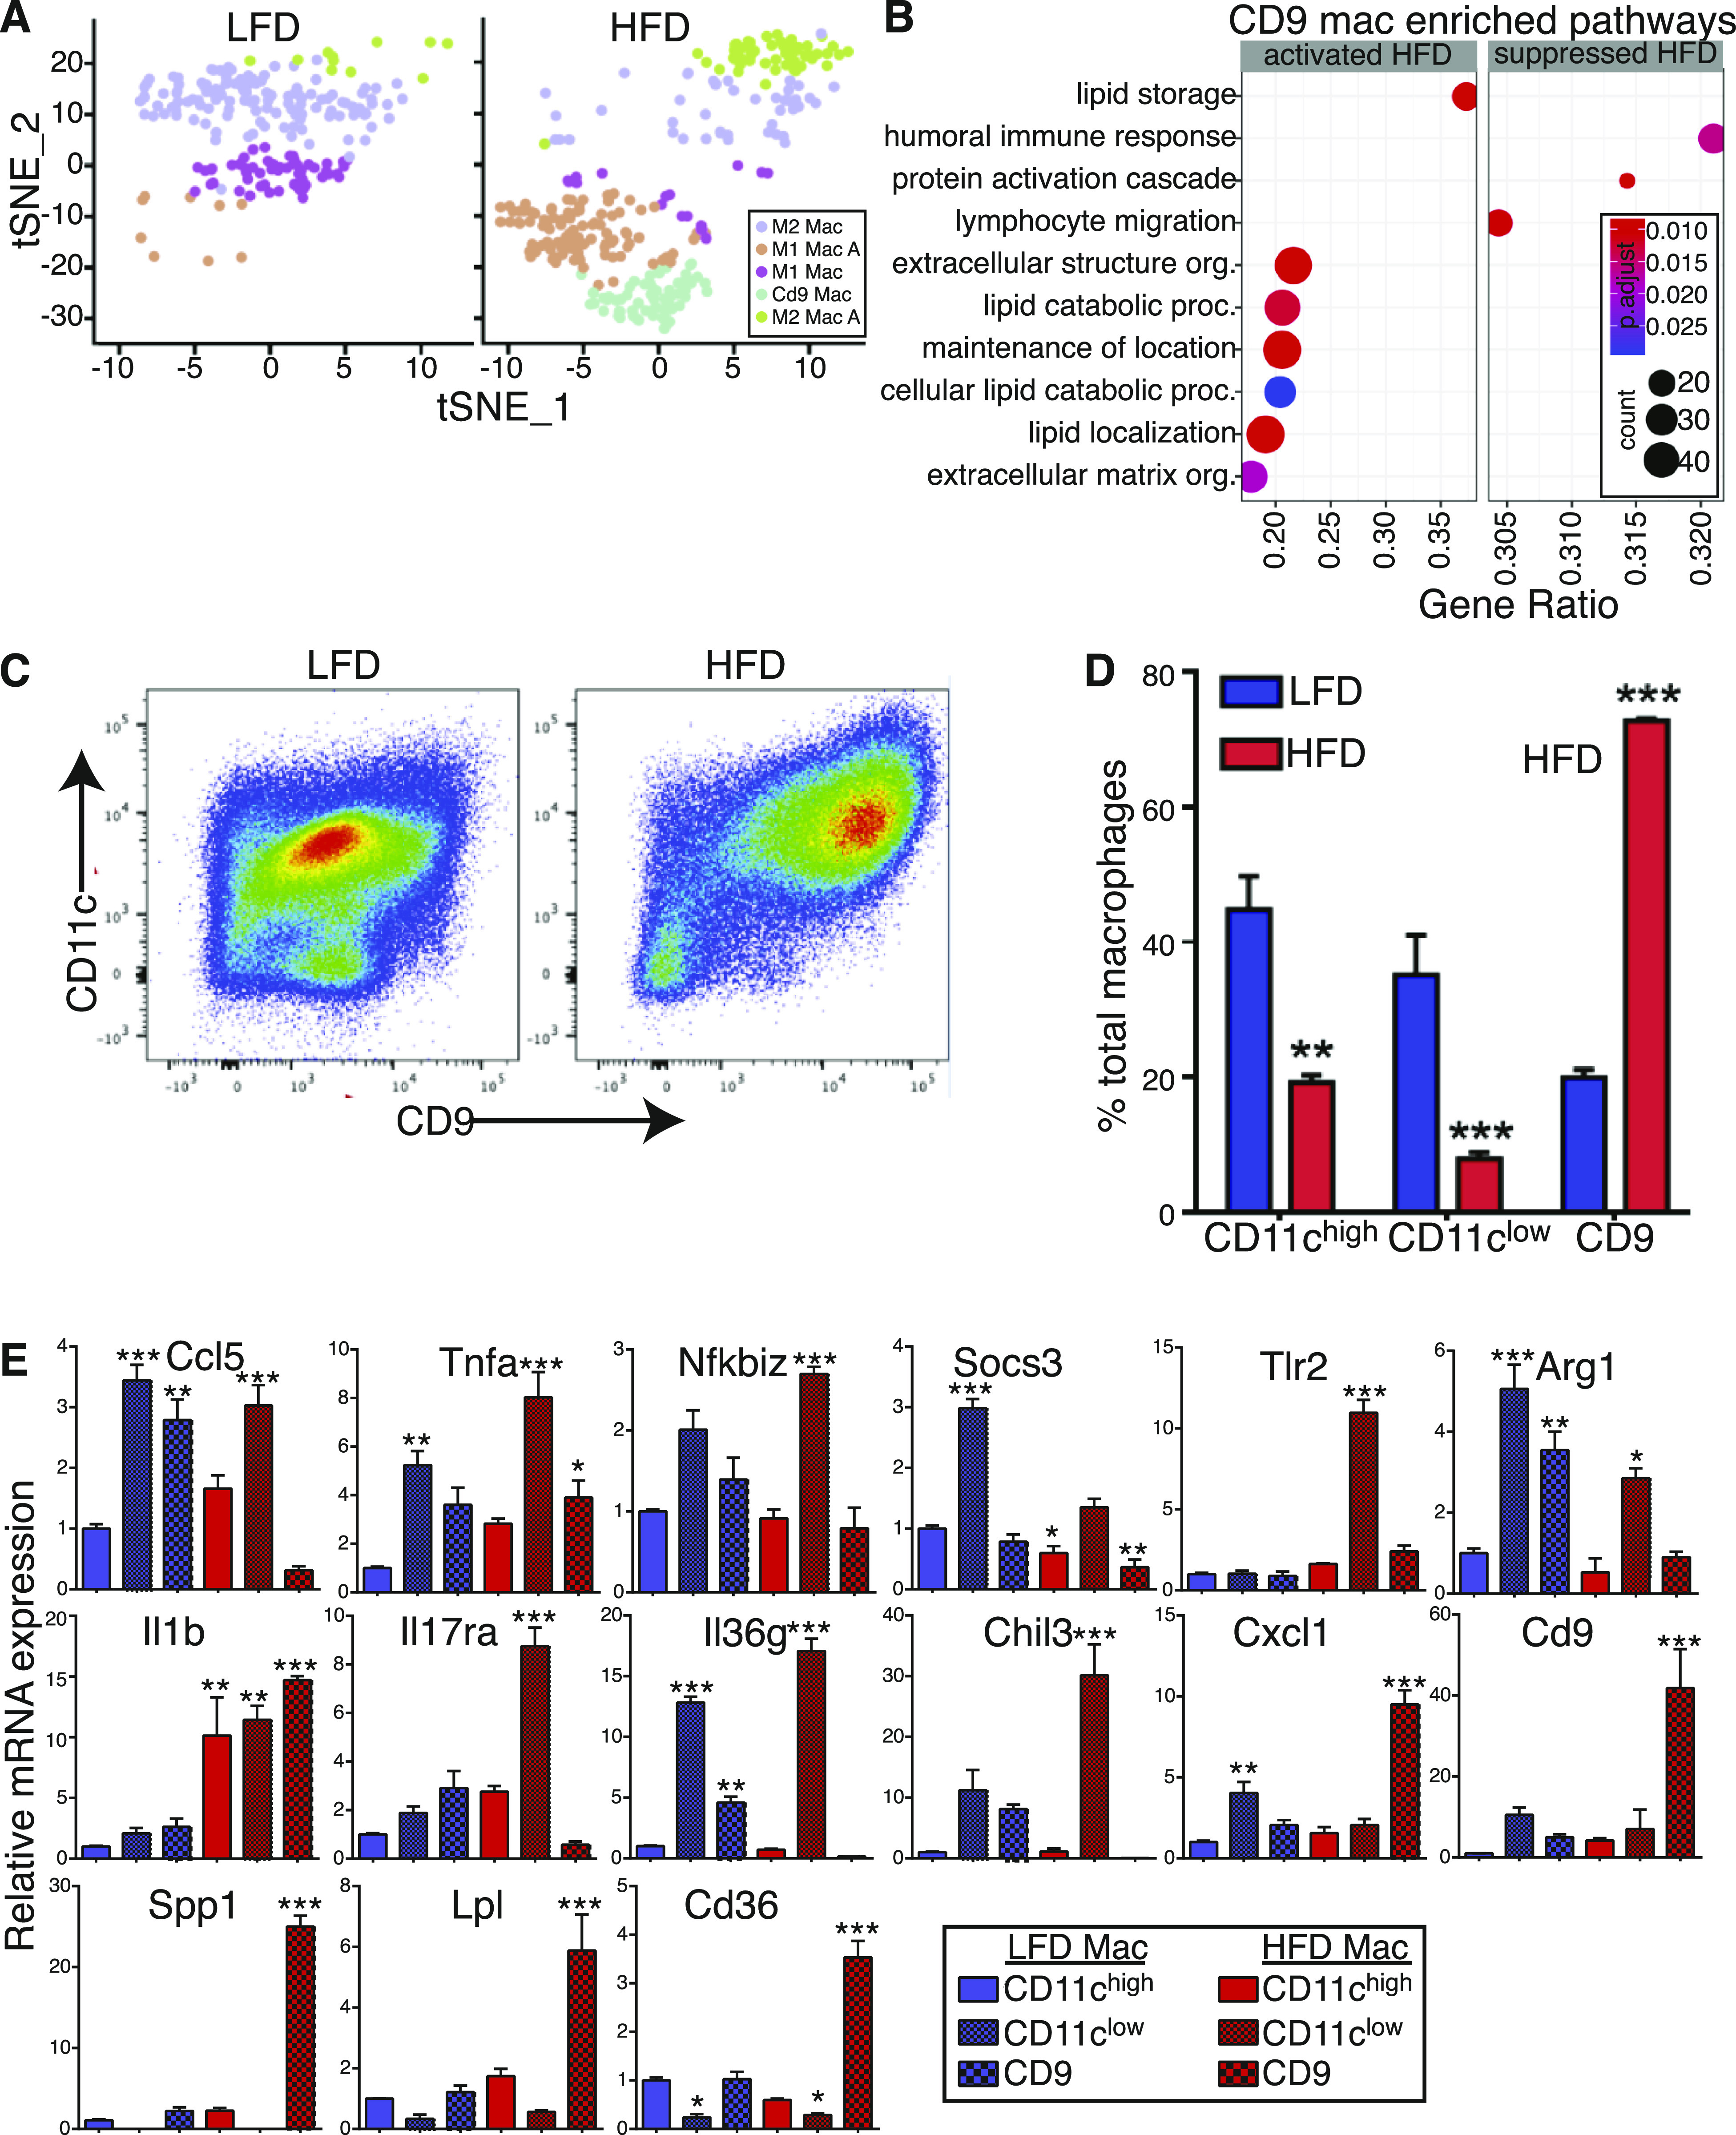
Figure 5. Accumulation of CD9+ macrophages in high-fat diet (HFD) white adipose tissue.

(A) Side-by-side t-SNE plots of macrophages. (B) Dot plot of gene ontology (biological process) of activated and suppressed pathways by HFD in CD9 macrophages. (C) Representative high scatter dot plot images of flow cytometry showing the appearance of CD11c, CD9 population in HFD. (D) Quantification of frequency of macrophages populations in the eWAT depot from 24-wk low-fat diet and HFD feed mice performed by flow cytometry (n = 8). (E) Real-time PCR analysis of select genes in sorted macrophages form eWAT depot in 24-wk low-fat diet and HFD feed mice.
