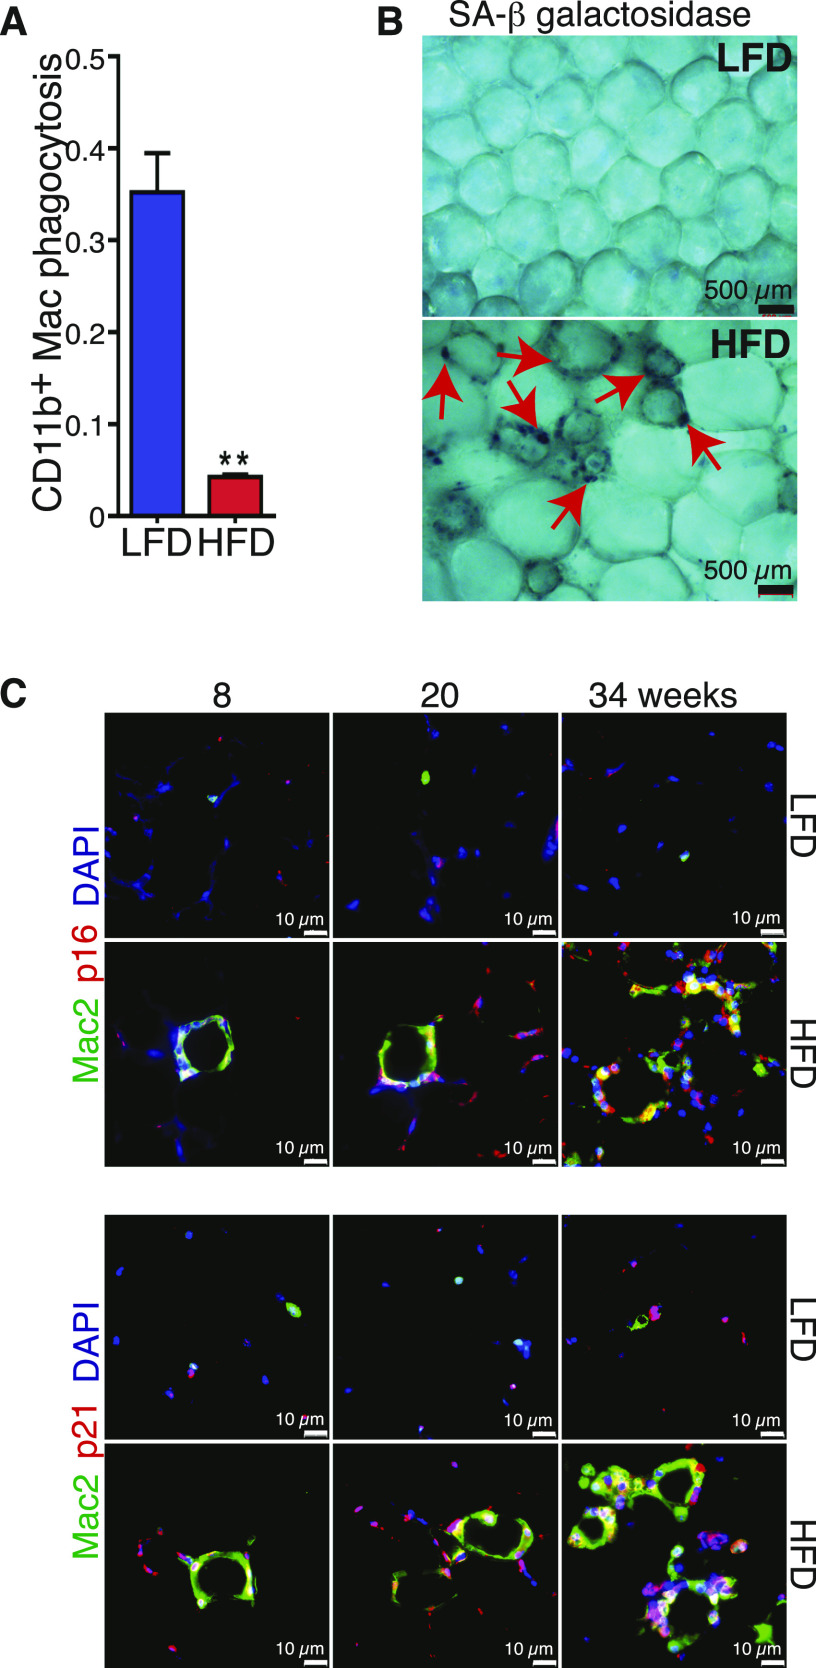
Figure 6. CD9+ macrophages are senescent cells.
(A) Quantification of macrophages in the eWAT depot from 24-wk low-fat diet (LFD) and high-fat diet (HFD) feed mice phagocytic capacity measured by flow cytometry (n = 8). (B) Senescence-associated (SA) b gal staining in fresh isolated eWAT from 24-wk LFD and HFD feed mice, scale bars 500 μm. (C) Representative image of Mac-2, P16, and P21 immunofluorescent co-staining in 8, 20 and 34-wk LFD and HFD feed mice, scale bars 10 μm. Data are presented as mean ± SEM. P-values*P < 0.05, **P < 0.01, ***P < 0.001.

