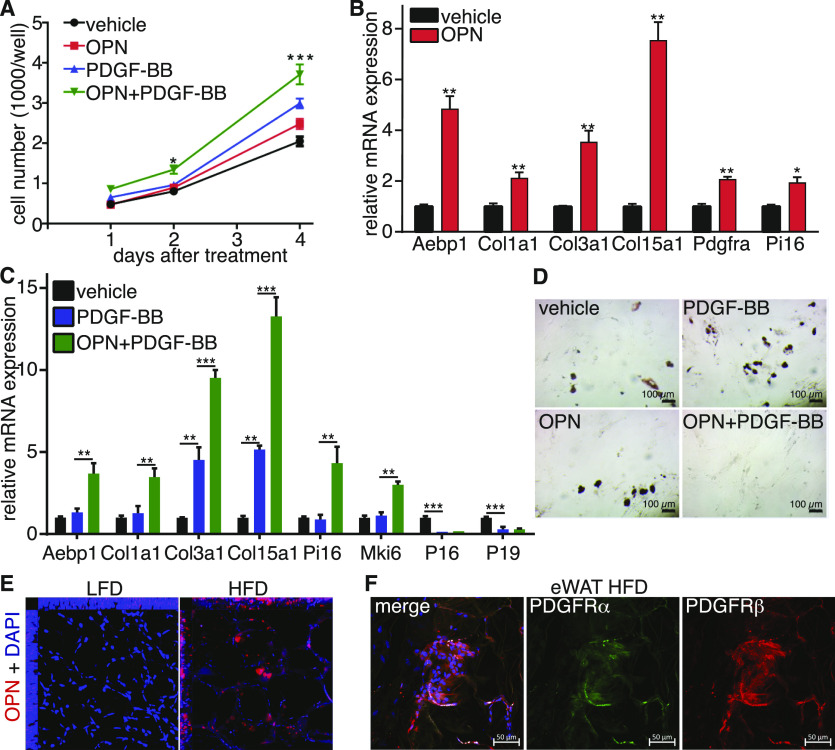
Figure 7. Osteopontin secreted by CD9+ macrophages cooperate with PDGF-BB to stimulate progenitor cell proliferation and inhibit adipogenesis.
(A) Quantification of cellular proliferation assay (n = 6). (B) Real-time PCR analysis of select genes in sorted progenitor cells treated with OPN or vehicle for 2 d. (C) Real-time PCR analysis of select genes in sorted progenitor cells treated with PDGF-BB alone, combined with OPN or vehicle for 2 d (n = 4). (D) Representative images of Oil Red O staining of in vitro differentiated progenitor cells treated with OPN, PDGF-BB, a combination of the two or vehicle for 2 d (n = 4), scale bars 100 μm. (E) Orthogonal view of z-stack images of whole mount immunostaining of OPN. (F) Representative image of whole mount of platelet-derived growth factor receptor α and platelet-derived growth factor receptor β immunofluorescent co-staining in eWAT for 24-wk high-fat diet feed mice, scale bars 50 μm. Data are presented as mean ± SEM. P-values. *P < 0.05, **P < 0.01, ***P < 0.001.

