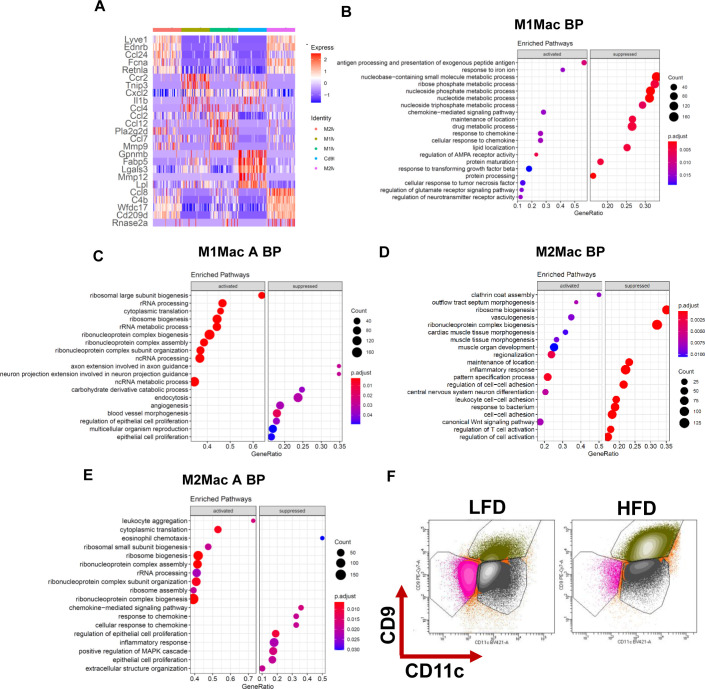
Figure S5. Accumulation of CD9+ macrophages in high-fat diet WAT.
(A) Heatmap of top 5 markers gene differentially expressed in macrophages. (B, C, D, E, F) Dot plot of gene ontology (molecular function) of activated and suppressed pathways in (B) M1 macrophages (C) M1 activated macrophages (D) M2 macrophages (E) M2 activated macrophages (F) Representative high scatter dot plot images of flow cytometry gating strategy of CD11c, CD9 macrophage population.

