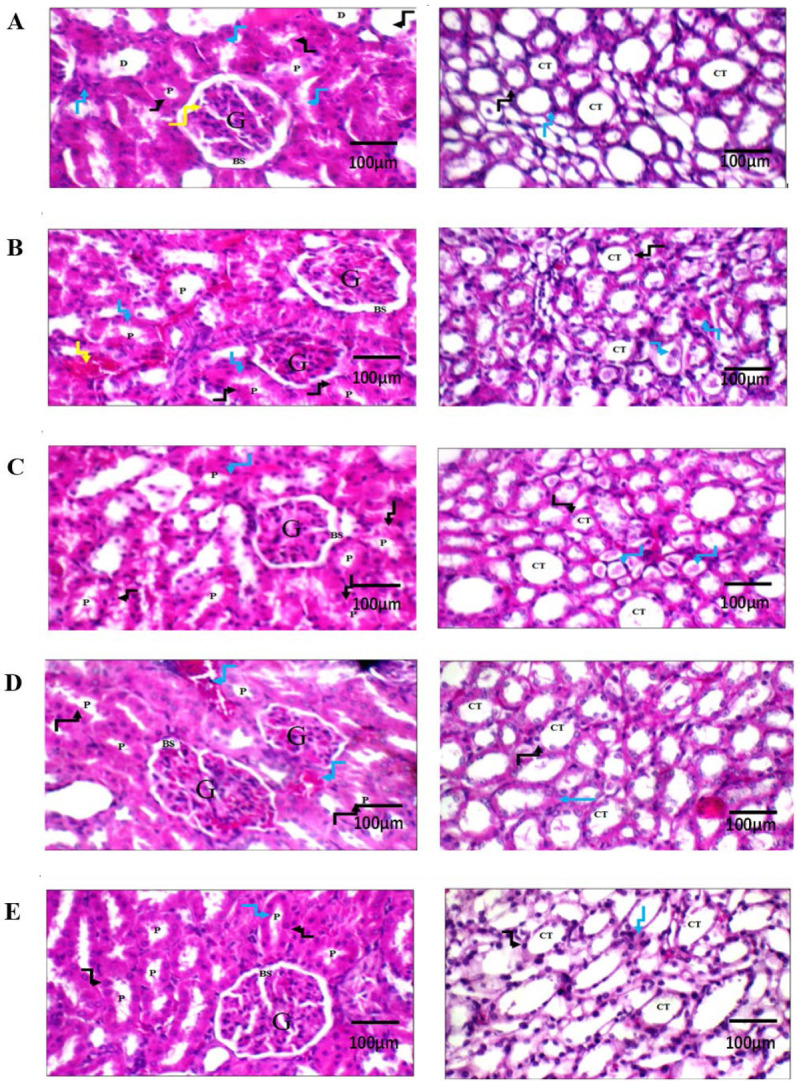
Fig. 5.

Histopathological evaluation of L-carnitine effect on renal tissue using H&E staining. Renal tissues of (A) normal control rats showing average glomerulus with average Bowman’s spaces, average proximal tubules with preserved brush borders (black arrow), average distal tubules, and average interstitium (blue arrow) along with average collecting tubules with average epithelial lining. (B) potassium dichromate-treated rats showing relatively small-sized glomeruli with average Bowman’s spaces, proximal tubules with apoptotic epithelial lining (black arrow) and brush borders (blue arrow), along with dilated congested blood vessels (yellow arrow). Renal medulla showed collecting tubules with congested epithelial lining (black arrow) and intra-tubular hyaline casts (blue arrow). (C) Rat treated with L-carnitine at 25 mg/kg showing average glomerulus with average Bowman’s space, proximal tubules with apoptotic epithelial lining (black arrow) and preserved brush borders (blue arrow). Renal medulla showed collecting tubules with average epithelial lining (black arrow) and intra-tubular hyaline casts (blue arrow). (D) Rat treated with L-carnitine at 50 mg/kg showing mildly congested glomeruli with average Bowman’s spaces, proximal tubules with preserved brush borders (black arrow), and mildly congested blood vessels (blue arrow). (E) Rat treated with L-carnitine at 100 mg/kg showing average glomerulus with average Bowman’s space, and proximal tubules with average epithelial lining (black arrow) and preserved brush borders (blue arrow). The left side magnification is 400× and the right side is 200×. G, Glomerulus; BS, Bowman’s spaces; P, proximal tubule; D, distal tubule; CT, collecting tubule.
