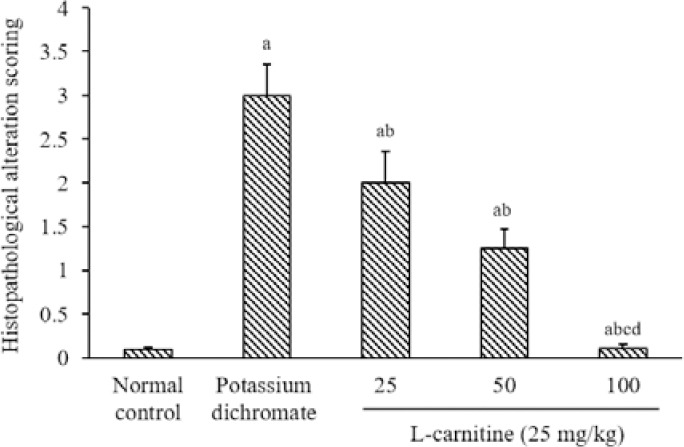
Fig. 6.

Renal tissue histopathological alteration scoring. Data are presented as mean ± SEM, n = 8. aP < 0.05 Indicates significant differences compared to the control group, bP < 0.05 statistically significant from potassium dichromate (15 mg/kg) group, cP < 0.05 versus L-carnitine at 25 mg/kg, and dP < 0.05 against L-carnitine at 50 mg/kg.
