
Figure 1. XWAS analysis of continuous or dichotomized residual age-at-onset in HD.
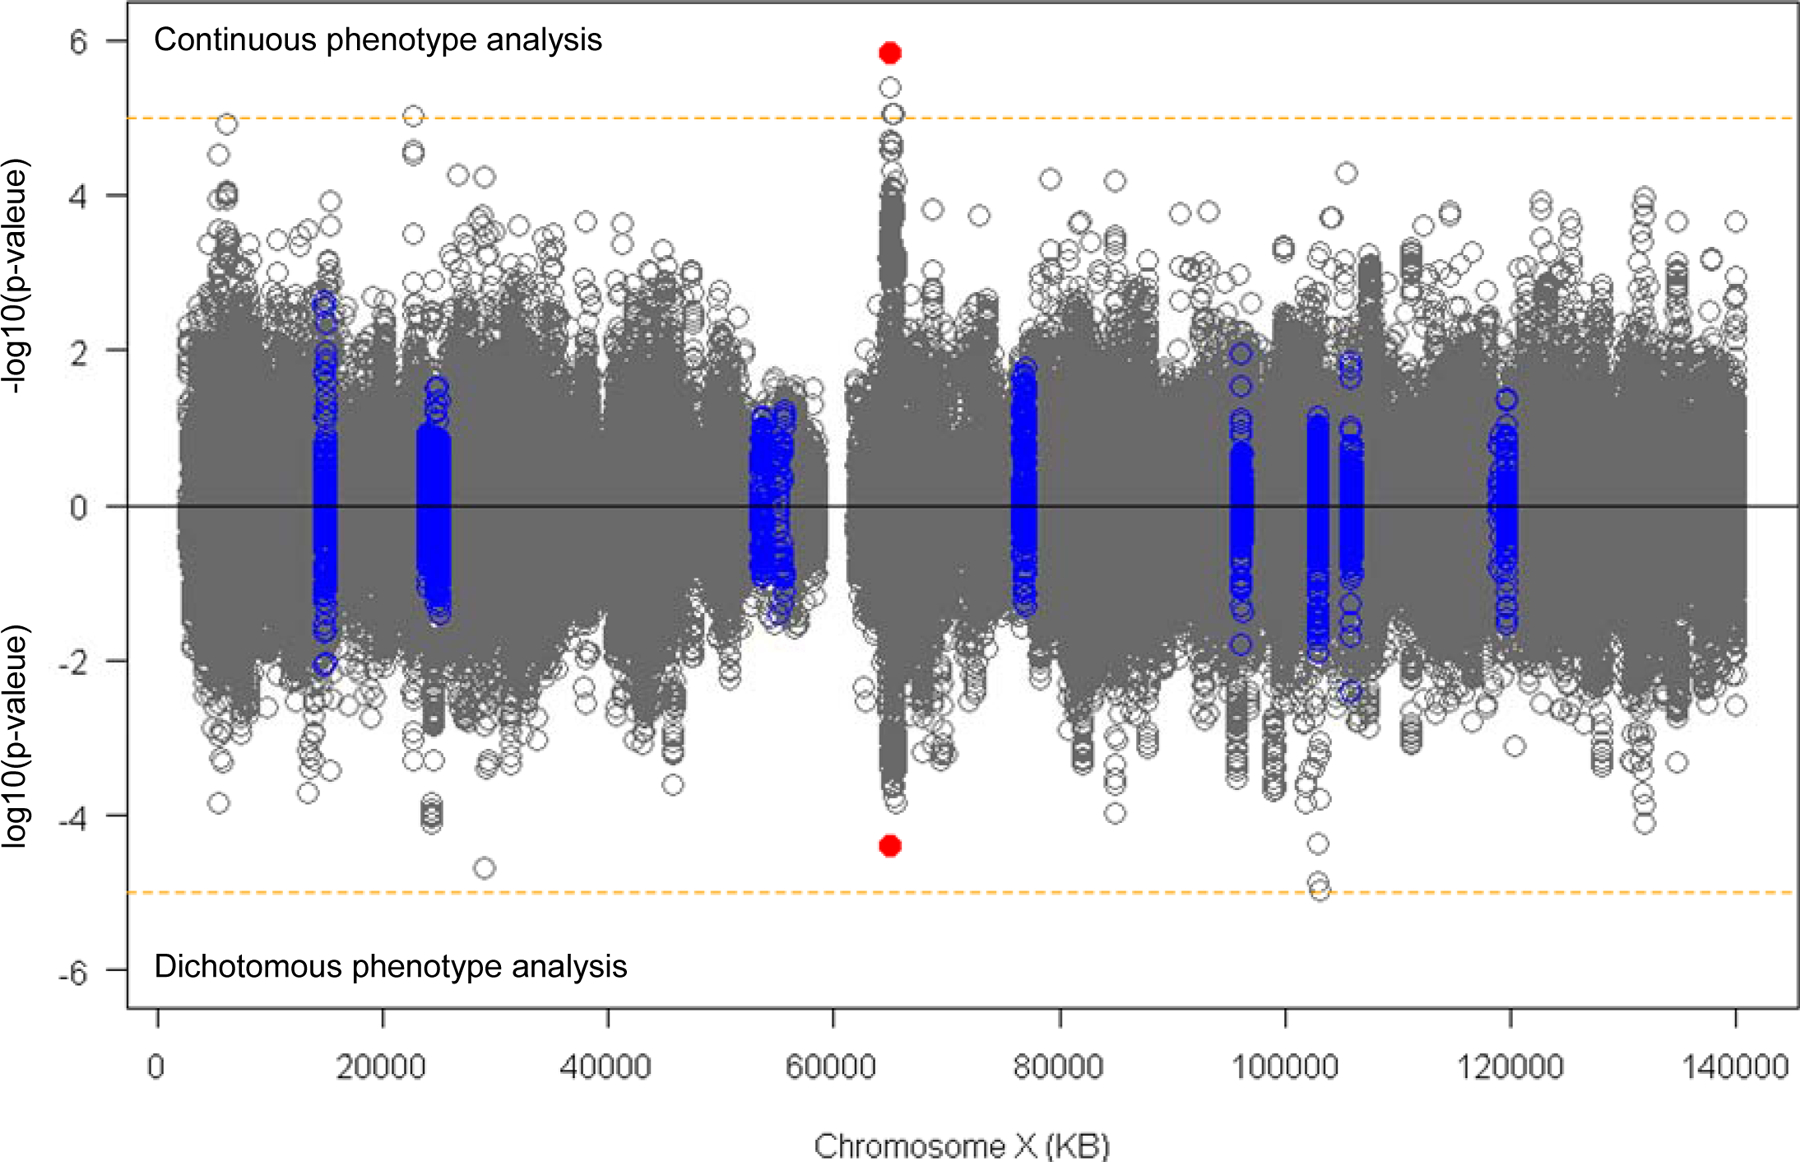
Linear mixed effects model XWAS analysis was performed to evaluate the levels of association between the test SNP and residual age-at-onset in continuous phenotype analysis (top panel) and dichotomous phenotype analysis (bottom panel). The Y-axis of top and bottom panels represent −log10(p-value) in continuous phenotype analysis and log10(p-value) in dichotomous phenotype analysis, respectively. Blue circles represent SNPs located in 50 KB flanking regions of DNA repair genes (see Table 1). Orange horizontal lines indicate suggestive significance (p-value, 0.00001). Red dots indicate the top SNP (rs59098970) at Xq12 region that generated suggestive significant modification signals. PARs (ChrX: 60001–2699520 and ChrX:154931004–155260560) were excluded from our XWAS due to low quality in genotype imputation